Kubernetes Monitoring: A Layer-by-Layer Guide
What to monitor in Kubernetes, from control plane and etcd to workloads, plus eBPF tracing with a DaemonSet, collection patterns and alerting that works.



Read in German: Kubernetes Monitoring: Ein Leitfaden Schicht für Schicht.
With this article I wanted to give a compact overview of which components to take into account when it comes to Kubernetes observability: from the hardware up to the workloads, and how to collect it all.
— Roman Hüsler, OpenSight
This guide covers Kubernetes monitoring layer by layer: what to watch at each level of the cluster, how to collect it with OpenTelemetry and eBPF, and what to alert on.
Contents
- Why Kubernetes monitoring is different
- Part 1: What to monitor
- Part 2: How to collect
- Part 3: Alert, plan and act
- Sources and further reading
Why Kubernetes monitoring is different
Kubernetes abstracts away a lot of complexity so that teams can ship faster. The price is visibility: it is easy to lose track of what is running, what it consumes and what the platform did on your behalf. A classic infrastructure has two things to watch, hosts and applications. Kubernetes adds a scheduler, a replicated state store, an API every component talks through, a container runtime, an overlay network and cluster DNS. When something breaks, the cause can be in any of them, and the symptom rarely points at it.
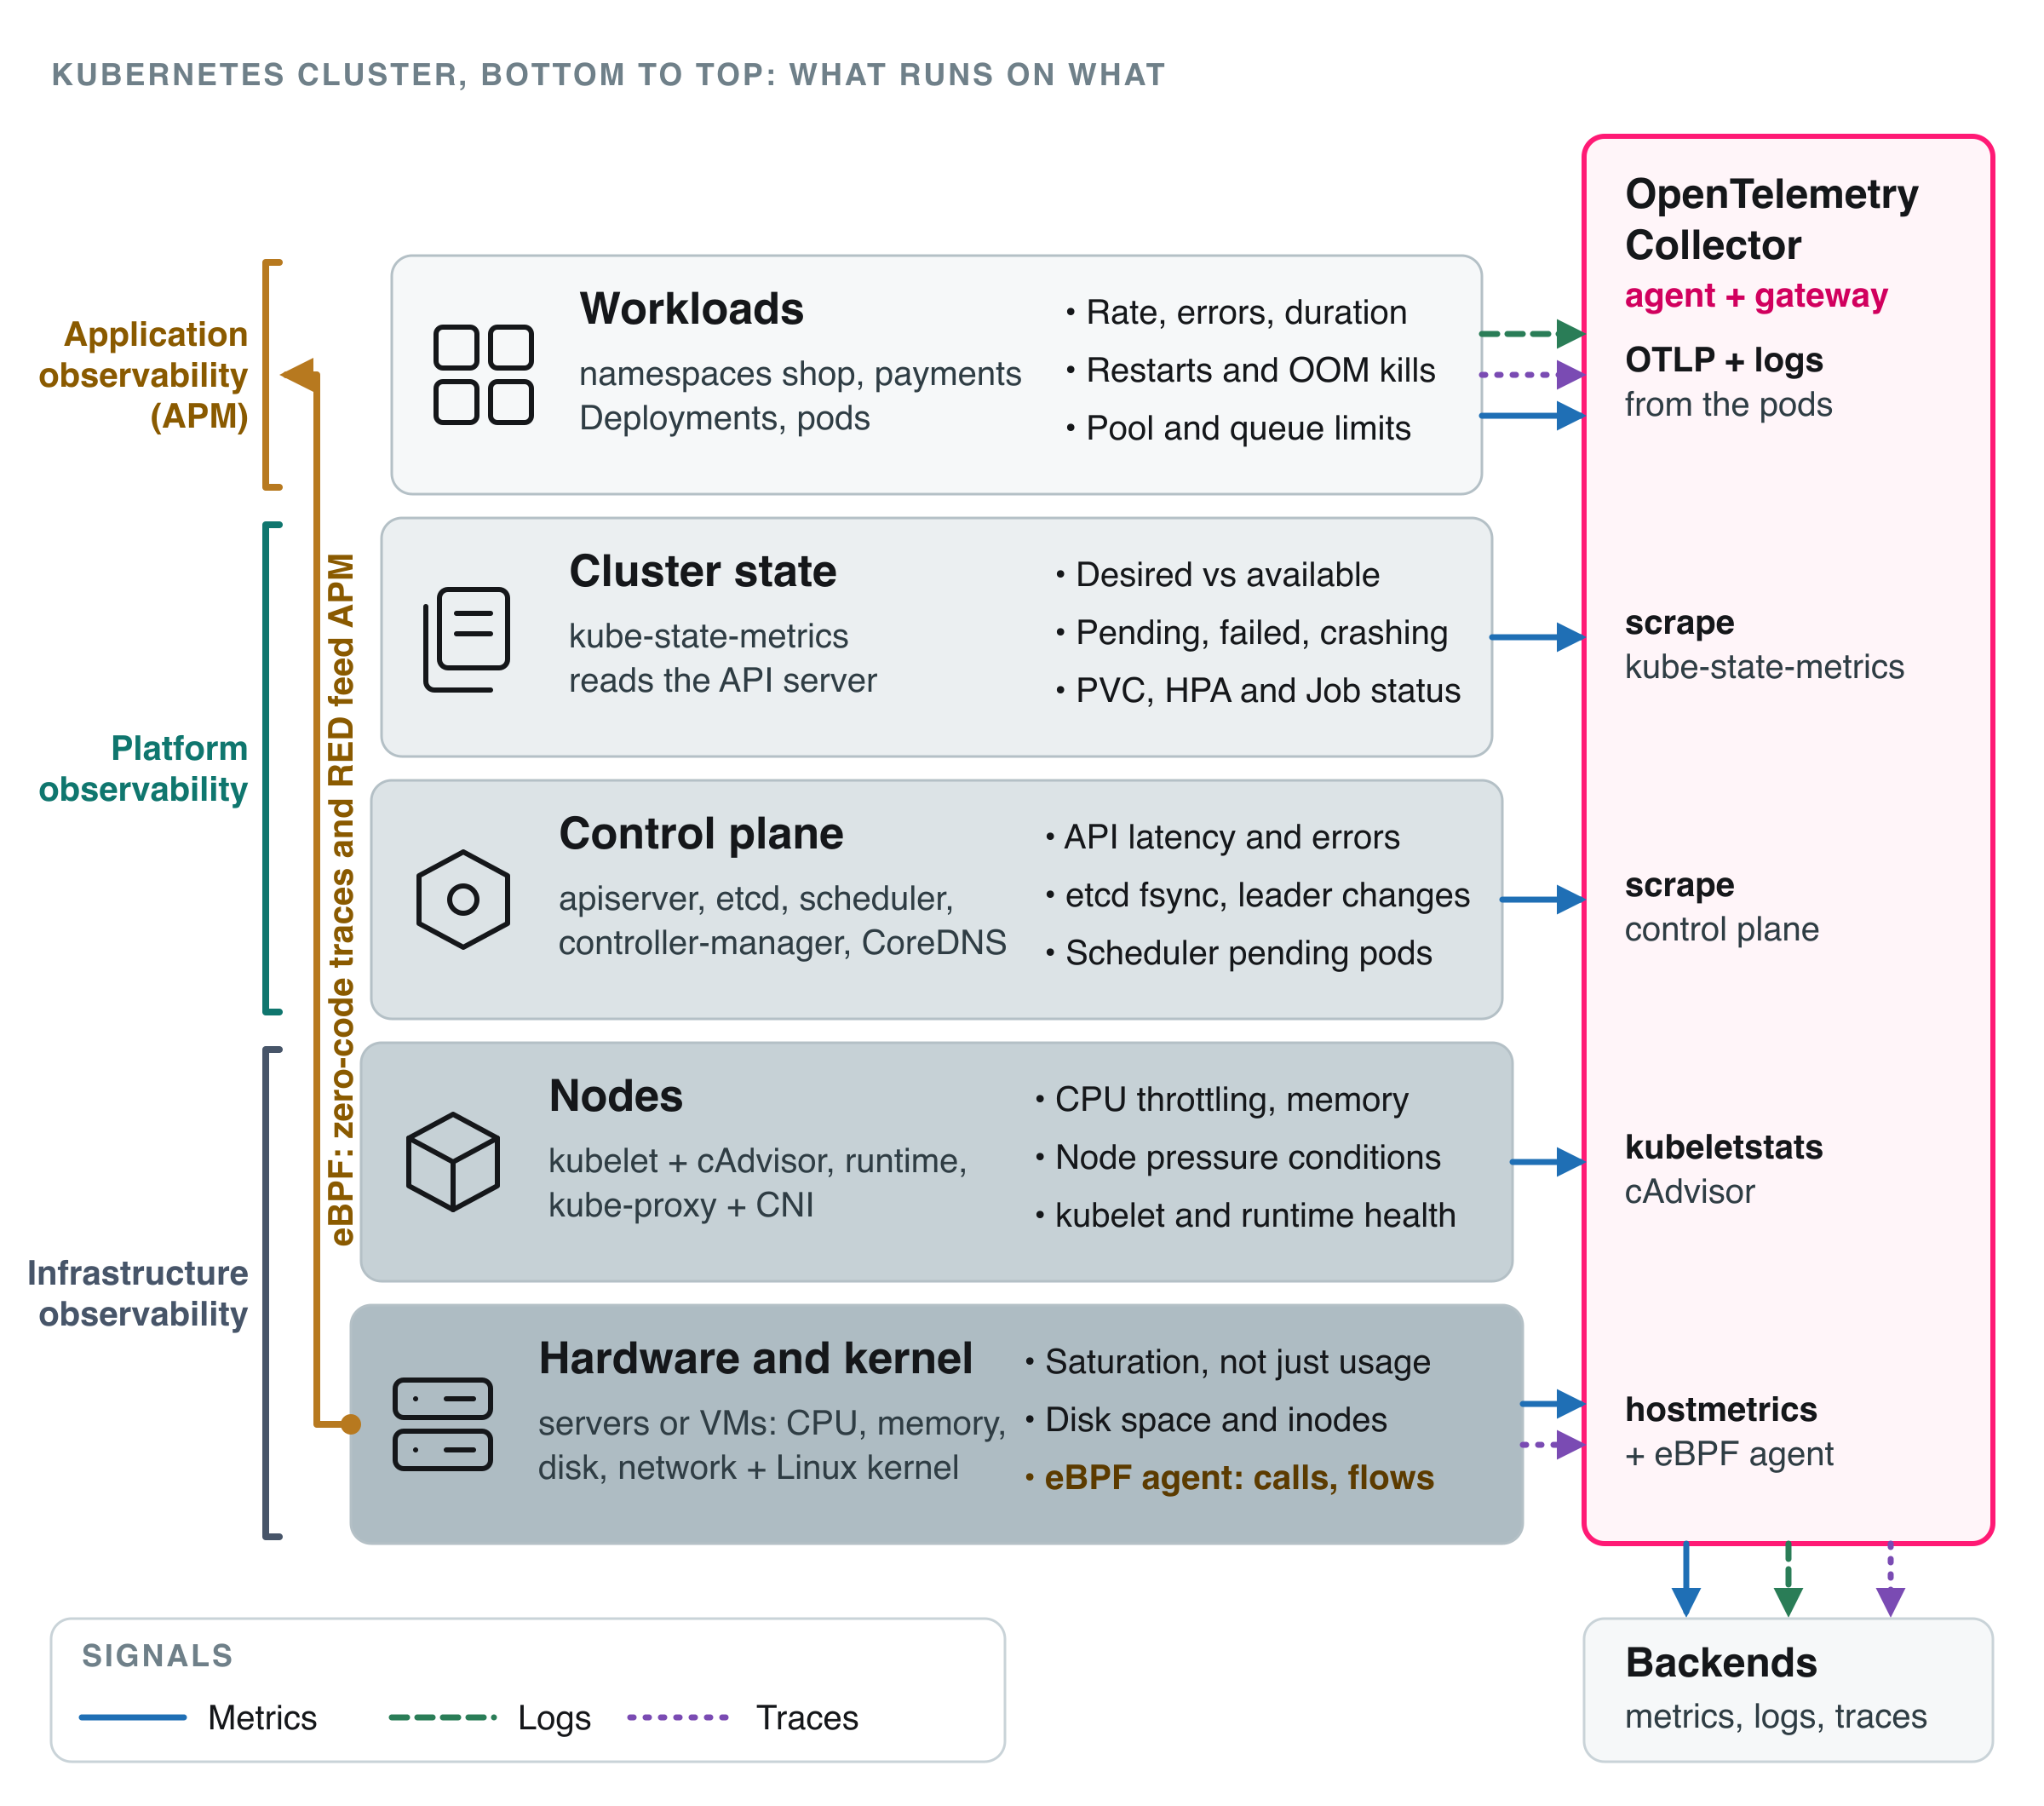
That is why monitoring starts with a map, and Figure 1 is that map: five layers, each with its own source of signals, and one collector that gathers them. Read it bottom to top as "what runs on what". Users feel problems in the workloads while the causes often sit lower, so collect all five layers and alert mostly on the top. The advice is vendor-neutral; every signal named here can be gathered with open source tooling.
Signals and questions
Kubernetes components expose thousands of time series; deciding which deserve attention is the work. Three frameworks keep that honest: the four golden signals (latency, traffic, errors, saturation) for any user-facing service, RED (rate, errors, duration) for things that serve requests, and USE (utilization, saturation, errors) for things that are consumed, such as nodes, disks and etcd. For every panel or alert, be able to say whether it answers "is the service healthy?" (a symptom) or "why is it unhealthy?" (a cause). Symptoms are for alerts; causes are for diagnosis.
How this guide is organised
The five layers fall into three views, usually owned by different teams: application observability, including APM, is layer 5 (application teams); platform observability is layers 3 and 4, control plane and cluster state (the platform team); infrastructure observability is layers 1 and 2, hardware and nodes (infrastructure and operations).
Part 1 has one chapter per layer, bottom-up, each with the same skeleton: What it is, Key signals (a table), Where the data comes from and Pitfalls. The chapters explain why a signal matters; the concrete metric names are collected once, in The minimum metric set. A closing chapter maps networking across the layers. Part 2 covers the collector: topology, Kubernetes context, eBPF, and cardinality and cost. Its rule of thumb: scrape cluster-wide targets exactly once. Part 3 turns the data into alerts, adds capacity planning, and ends with a checklist.
Part 1: What to monitor
Part 1 follows the three views: infrastructure observability (Layers 1 and 2), platform observability (Layers 3 and 4) and application observability (Layer 5).
Layer 1: Hardware and kernel
What it is
The servers or VMs under your cluster, with CPU, memory, disk, network and the Linux kernel on top. Saturation here looks like application slowness. On managed node pools the machines are still yours to watch.
Key signals
| Signal | Metric example | Why it matters |
|---|---|---|
| CPU saturation | node_cpu_seconds_total, run queue, PSI | Utilization alone hides contention |
| Memory availability | node_memory_MemAvailable_bytes | The kernel can OOM-kill before Kubernetes evicts |
| Disk space and inodes | node_filesystem_avail_bytes, _files_free | Images and logs fill disks; DiskPressure evicts pods |
| Disk I/O | node_disk_io_time_weighted_seconds_total | etcd and databases are latency-sensitive |
| Network | node_network_receive_drop_total, conntrack entries versus limit | A full conntrack table causes random connection failures |
| Clock and descriptors | node_timex_offset_seconds, file descriptors | Certificates and etcd dislike clock drift |
Where the data comes from
- node-exporter as a DaemonSet, or the Collector's
hostmetricsreceiver; both need read access to the host's/proc,/sysand filesystems. The must-have series are in The minimum metric set. - Node logs from journald: kubelet and container runtime run as systemd units, so their logs (and the kernel's OOM and disk messages) are not in any pod's stdout. Collect them from the journal, filtered to the units you care about. The reference implementation described at the end reads
/var/log/journalfor this. - eBPF probes also live in this layer; see eBPF auto-instrumentation and profiling.
Pitfalls
- Cluster averages hide the one hot node; keep the node label. Filesystem metrics for tmpfs and overlay mounts are noise.
- The hypervisor can throttle a disk or NIC where the guest cannot see it; add the cloud provider's volume metrics.
Layer 2: Nodes
What it is
The node software that runs your pods: the kubelet (with cAdvisor built in), the container runtime, kube-proxy and the network plugin (CNI). It fails in ways that look like application bugs: slow starts, restarts without a crash, pods stuck in ContainerCreating.
Key signals
| Signal | Metric example | Why it matters |
|---|---|---|
| CPU throttling | container_cpu_cfs_throttled_periods_total over _periods_total | Tail latency with low average CPU |
| Container pressure (PSI) | container_pressure_cpu_waiting_seconds_total and the memory and I/O variants | Time lost to contention, which usage and throttling do not show |
| Memory working set | container_memory_working_set_bytes | The figure the OOM killer acts on |
| Node conditions | kube_node_status_condition (Ready, MemoryPressure, DiskPressure, PIDPressure) | Early warning before evictions |
| Pod lifecycle | kubelet_pleg_relist_duration_seconds, kubelet_pod_start_duration_seconds | A slow PLEG precedes a node flipping to NotReady |
| Runtime and volumes | kubelet_runtime_operations_errors_total, kubelet_volume_stats_* | Start failures; the basis for PVC disk-full alerts |
| Service programming and CNI | kubeproxy_sync_proxy_rules_duration_seconds, FailedCreatePodSandBox events | Out-of-addresses CNIs strand pods |
Under pressure the kubelet evicts pods once hard thresholds are crossed (defaults include memory.available<100Mi and nodefs.available<10%), so a pressure condition means workloads are about to be killed. Alert on Ready=false and on persistent pressure, not on a blip. How much of a node is left for pods is covered in Capacity and headroom.
Where the data comes from
- The kubelet serves several endpoints on port 10250 (authentication required):
/metrics,/metrics/cadvisorfor per-container usage,/metrics/resourceand/metrics/probes. The Collector'skubeletstatsreceiver reads pod and container usage from the same source. - Node conditions come from kube-state-metrics (Layer 4). The 19 cAdvisor series worth keeping and the container PSI family are in The minimum metric set.
Pitfalls
- Empty-label series double-count. cAdvisor also reports cgroup-level aggregates with an empty
containerorimagelabel; summing without filtering counts usage twice. The reference implementation drops them at scrape time and keeps only physical disk and network devices. - Kubelet serving certificates are often self-signed;
insecure_skip_verifyis a lab shortcut, not a design. kube-proxy metrics do not exist when your CNI replaces it. - Whether to set CPU limits at all is debated; whichever side you choose, measure throttling so that you know what it costs.
Layer 3: Control plane
What it is
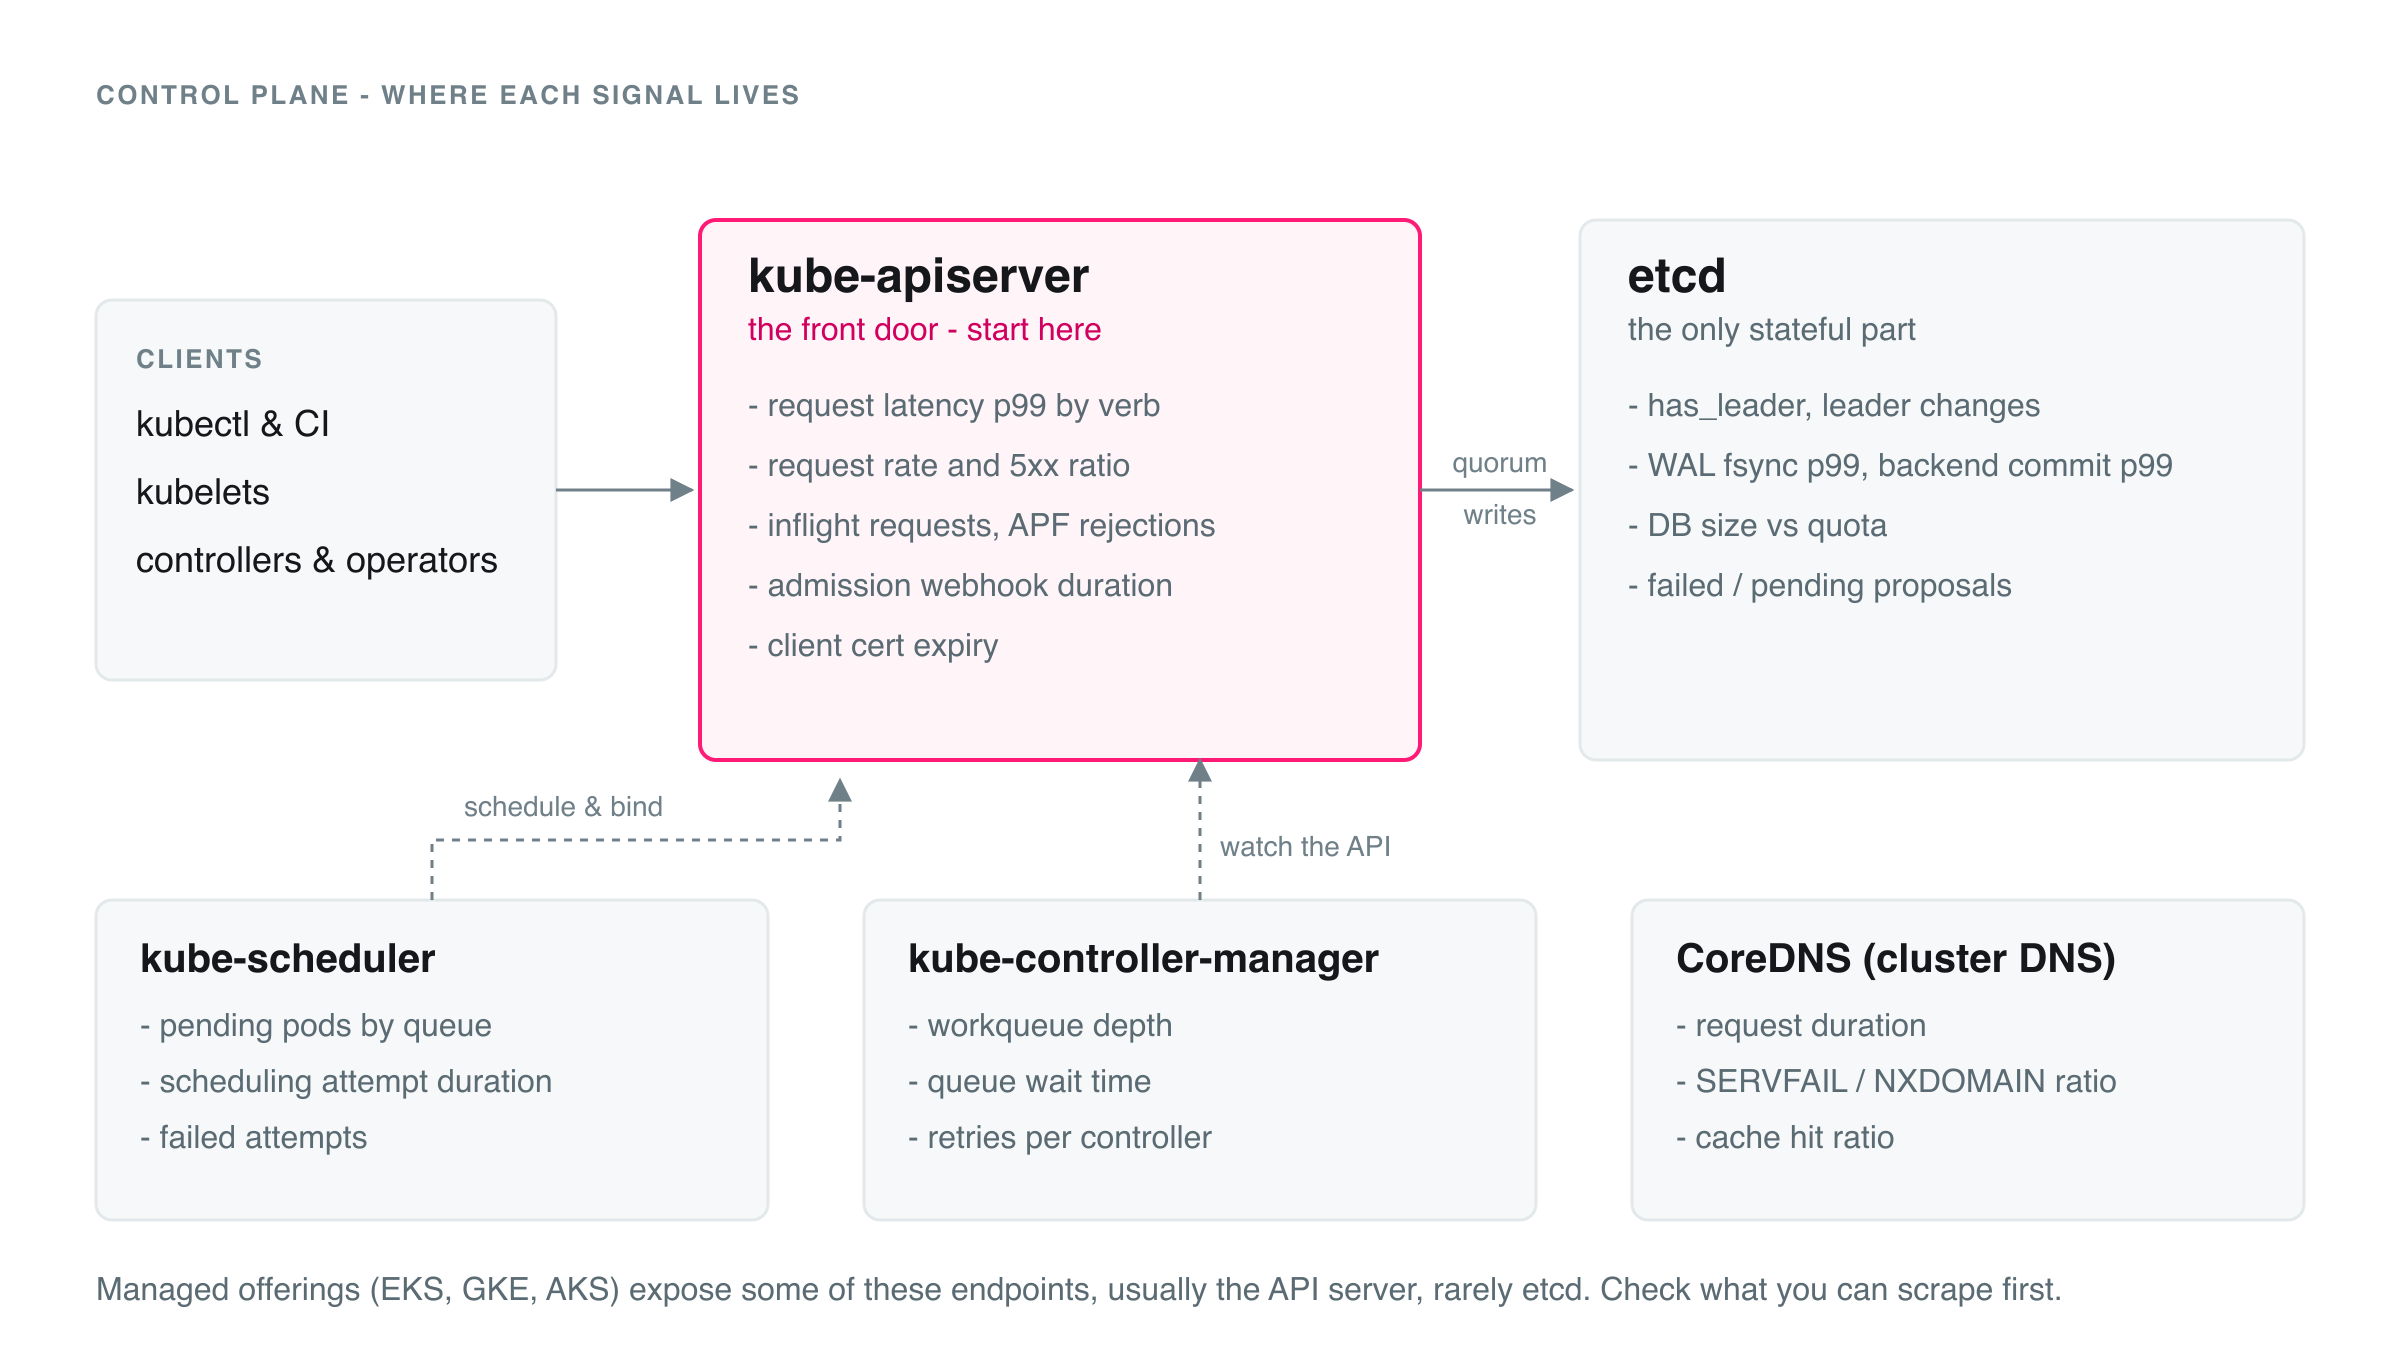
The part of Kubernetes that decides: the API server (everything talks through it), etcd (the only stateful part, a quorum store: three members tolerate one failure, five tolerate two), the scheduler, the controller manager, and cluster DNS (CoreDNS, technically a workload but something every call depends on). If this layer is unhealthy, nothing new can be scheduled or changed, even while existing pods keep serving traffic.
Key signals
| Signal | Metric example | Why it matters |
|---|---|---|
| API server latency | apiserver_request_duration_seconds p99 per verb, excluding WATCH and CONNECT | The health of the cluster; judge LIST and GET separately |
| API server errors and rejection | apiserver_request_total by code, apiserver_flowcontrol_rejected_requests_total | 5xx means API or etcd trouble; 429 means throttled clients |
| Admission webhooks | apiserver_admission_webhook_admission_duration_seconds | A slow webhook with failurePolicy: Fail blocks deployments cluster-wide |
| Certificate expiry | apiserver_client_certificate_expiration_seconds | A classic self-inflicted outage |
| etcd leader | etcd_server_has_leader, etcd_server_leader_changes_seen_total | No leader means no writes; churn means slow disk or network |
| etcd disk latency | etcd_disk_wal_fsync_duration_seconds, etcd_disk_backend_commit_duration_seconds | etcd docs: p99 below about 10 ms (WAL fsync) and 25 ms (commit) |
| etcd size versus quota | etcd_mvcc_db_total_size_in_bytes, etcd_server_quota_backend_bytes | The default 2 GiB quota makes the cluster read-only when hit |
| Scheduler | scheduler_pending_pods by queue, scheduler_scheduling_attempt_duration_seconds | A growing unschedulable queue means pods cannot fit |
| Controller manager | workqueue_depth, workqueue_queue_duration_seconds | Growing queues mean a controller cannot keep up |
| CoreDNS | coredns_dns_request_duration_seconds, SERVFAIL ratio in coredns_dns_responses_total | DNS trouble looks like sporadic application latency |
Where the data comes from
- Prometheus-format
/metricsendpoints on each component, plus/livezand/readyzon the API server (the older/healthzis deprecated). Whether you can reach them depends on the platform, see the next section. - Do not expect scraping to work by default. The reference implementation ships control plane scraping off (
controlPlane.enabled: false); switched on, it covers the API server, scheduler, controller manager and cluster DNS. etcd is a separate integration with its own metrics port (2381 in the reference default, set through etcd's--listen-metrics-urls), distinct from the client port 2379, which is normally protected by TLS client certificates. - Where you cannot look inside, measure from outside: probe
/readyz, track API latency as your own clients see it, and run a canary Deployment whose scheduling and rollout time you record. - Control plane logs. Where the components run as static pods in
kube-system, ordinary pod-log collection already picks them up; kubelet and containerd logs are in journald (Layer 1). Where the provider runs the control plane, the logs never reach your nodes and you must switch on the provider's export: EKS control plane logging (api,audit,authenticator,controllerManager,scheduler, each off by default) to CloudWatch Logs, GKE control plane logs to Cloud Logging (changing the setting restarts the control plane, a short outage on zonal clusters), AKS diagnostic settings to a Log Analytics workspace (categories such askube-apiserver,kube-controller-manager,kube-scheduler,kube-audit). - What is worth reading: etcd slow-request warnings ("apply request took too long") and leader elections; API server errors and webhook timeouts; scheduler reasons for unschedulable pods (also in Events); controller-manager reconcile errors.
- Audit logs are a signal of their own: they answer who did what, including who deleted a Deployment. The API server writes them only with an audit policy (
--audit-policy-file) and a backend, a log file (--audit-log-path) or a webhook (--audit-webhook-config-file). Rules set a level (None,Metadata,Request,RequestResponse) and the first match wins. LogMetadatafor most resources and neverRequestResponsefor Secrets, whose bodies would copy secret values into your logs. They are high volume: addNonerules for noisy requests and omit theRequestReceivedstage. On managed clusters they arrive through the provider export (AKS offerskube-audit-admin, which leaves out get and list events).
Managed, hosted and self-managed control planes
Who runs the control plane decides what you can see. These capabilities change quickly, so verify them for your version.
| Platform | Control plane visible to you? | Bundled monitoring stack | Watch out for |
|---|---|---|---|
| EKS, GKE, AKS | Partly. EKS: API server metrics only. GKE: API server, scheduler, controller manager when enabled. AKS: includes etcd, via managed Prometheus | The provider's monitoring service | Logs and audit logs exist only after you enable the export |
| OpenShift | Yes, in-cluster | Platform monitoring in openshift-monitoring (Prometheus, Alertmanager, node-exporter, kube-state-metrics, Thanos Querier), plus optional user workload monitoring | Do not deploy a second kube-state-metrics or node-exporter; read from the existing stack. Privileged collectors and eBPF agents need a security context constraint that allows them |
| Rancher (RKE2, K3s) | Rancher is a management layer; visibility follows the cluster type. RKE2: etcd metrics need etcd-expose-metrics (default false). K3s: the control plane runs in one process, SQLite (kine) by default, embedded etcd for HA | Rancher Monitoring: Prometheus Operator, Prometheus, Alertmanager, Grafana, node-exporter, kube-state-metrics, per cluster (newer versions also offer a dashboards-only chart; check yours) | Same as OpenShift: do not collect twice. Hosted and K3s clusters need their own scrape configuration; with SQLite there is no etcd to scrape |
| Kubermatic Kubernetes Platform (KKP) | User cluster control planes run as pods in a seed cluster, so from inside it behaves like a hosted service | Its own monitoring, logging and alerting (MLA) stack, for the platform and for user clusters | Check which pieces you already get before adding your own |
| Self-managed (kubeadm) | Everything | None | Scheduler and controller manager bind to 127.0.0.1 and etcd serves metrics on 127.0.0.1:2381 by default, so a collector on the pod network cannot reach them without changes |
Pitfalls
- API server histograms are large; allow-list the metrics and buckets you use, and exclude long-lived
WATCHandCONNECTrequests from latency quantiles. - On hosted clusters you see nothing from the control plane logs until you enable the export, and audit logs can dominate your log bill; filter them.
- A noisy controller or operator shows up as inflight and rejected requests before anything else breaks.
Layer 4: Cluster state
What it is
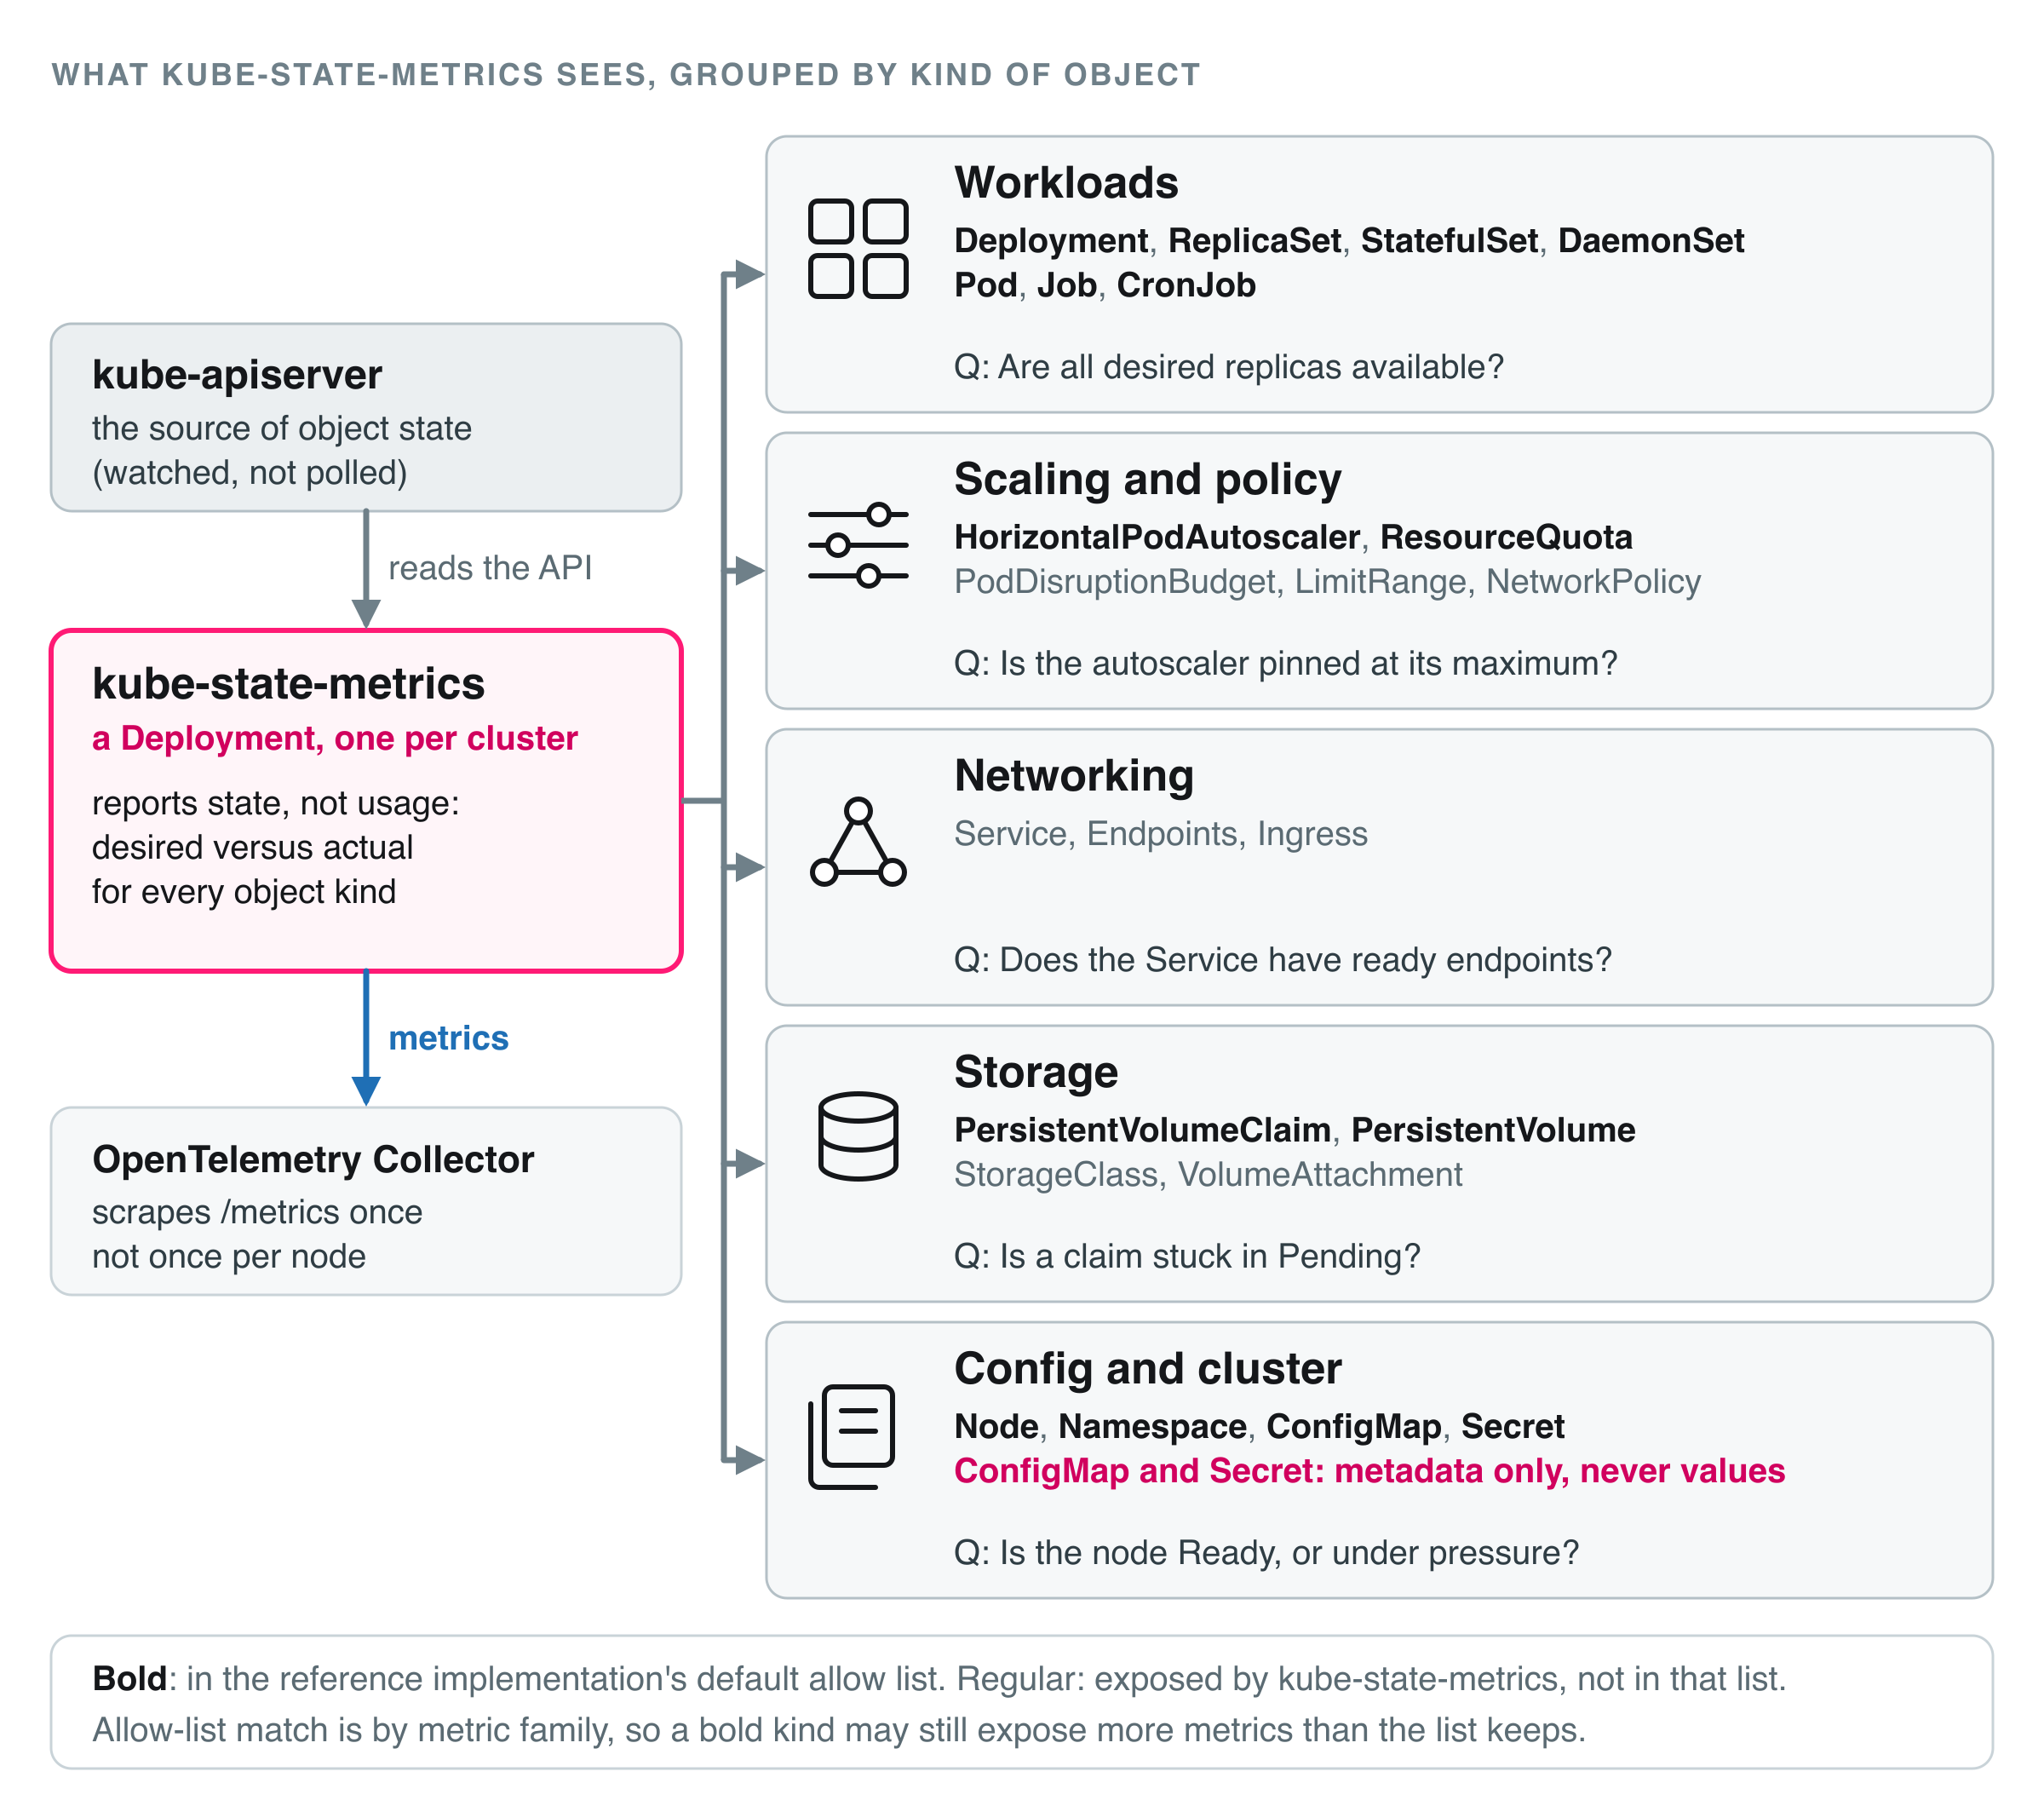
What Kubernetes believes about its objects: desired versus actual replicas, pod phases, volume claims, autoscalers and jobs (Figure 3 groups the kinds). It answers "does reality match what was asked for?" and is the most useful source for Kubernetes-specific alerts. It comes from kube-state-metrics and Events. The requests and quotas it reports are also the raw material for Capacity and headroom.
Key signals
| Signal | Metric example | Why it matters |
|---|---|---|
| Rollout gap | kube_deployment_spec_replicas versus _status_replicas_available | A persistent gap is a failed rollout |
| Pod phase | kube_pod_status_phase (Pending, Failed, Unknown) | Stuck pods |
| Crash loops, OOM, restarts | kube_pod_container_status_waiting_reason, _last_terminated_reason, _restarts_total | Tells OOMKilled from an application crash |
| Storage | kube_persistentvolumeclaim_status_phase | A Pending PVC blocks its pods |
| Autoscaling | HPA current replicas versus _spec_max_replicas | An HPA pinned at its maximum is a capacity warning |
| Quotas | kube_resourcequota (used versus hard) | Deployments fail quietly when a quota is hit |
| Jobs | kube_job_status_failed | Failed jobs fail silently unless watched |
| Events | FailedScheduling, BackOff, Unhealthy, FailedMount, Evicted, NodeNotReady | They explain why |
Where the data comes from
- kube-state-metrics is a small Deployment that watches the API and turns object state into metrics; it reports state, not usage. The reference implementation's default allow list keeps 43 patterns (see The minimum metric set);
kube_pod_owneris the one you need for owner joins. - Events are a signal of their own, and the API keeps them for about an hour by default. Collect them as logs with a single collector and filter by reason and level, because Normal events are chatty. The OpenTelemetry
k8sobjectsreceiver can watch them (it needs list and watch permission on events and exactly one replica, see Collector topology):
receivers:
  k8sobjects:
    auth_type: serviceAccount
    objects:
      - name: events
        mode: watch
        field_selector: type=Warning    # Warning events only
service:
  pipelines:
    logs: { receivers: [ k8sobjects ], exporters: [ otlp ] }   # singleton Deployment, one replica
The API aggregates repeats into one Event with a count (or series) field, so counting log lines undercounts: read the count.
Pitfalls
- kube-state-metrics exists once per cluster; if every agent scrapes it you get N copies of every series (see Collector topology). Labels are not exported by default; allow-list them sparingly.
- A quota failure is quiet: pods are never created, so nothing is Pending. The signal is in Events and the ReplicaSet conditions.
Layer 5: Workloads
What it is
Your applications: namespaces, Deployments, StatefulSets and their pods. This is the layer users feel, and the home of application observability and APM; it needs the golden signals plus the Kubernetes view of the same pods.
Key signals
| Signal | Metric example | Why it matters |
|---|---|---|
| Rate, errors, duration | Application histograms and counters per endpoint (or eBPF-derived RED metrics) | The symptom, and the basis for SLOs |
| Saturation | Thread pools, connection pools, queue depth | Shows the slowdown before errors appear |
| Throttling, pressure and OOM | Layer 2 container metrics per workload | The silent killers (below) |
| Probes and rollouts | prober_probe_total, kube_pod_status_ready, PodDisruptionBudget headroom | Misconfigured probes cause self-inflicted incidents; budgets decide whether a node drain can proceed |
| Business signals | Orders, logins, queue age | What the product is for |
Requests, limits and real usage. A request is what the scheduler reserves, a limit is what the kernel enforces, and real usage in between is what capacity planning needs. Compare the three over days, not minutes.
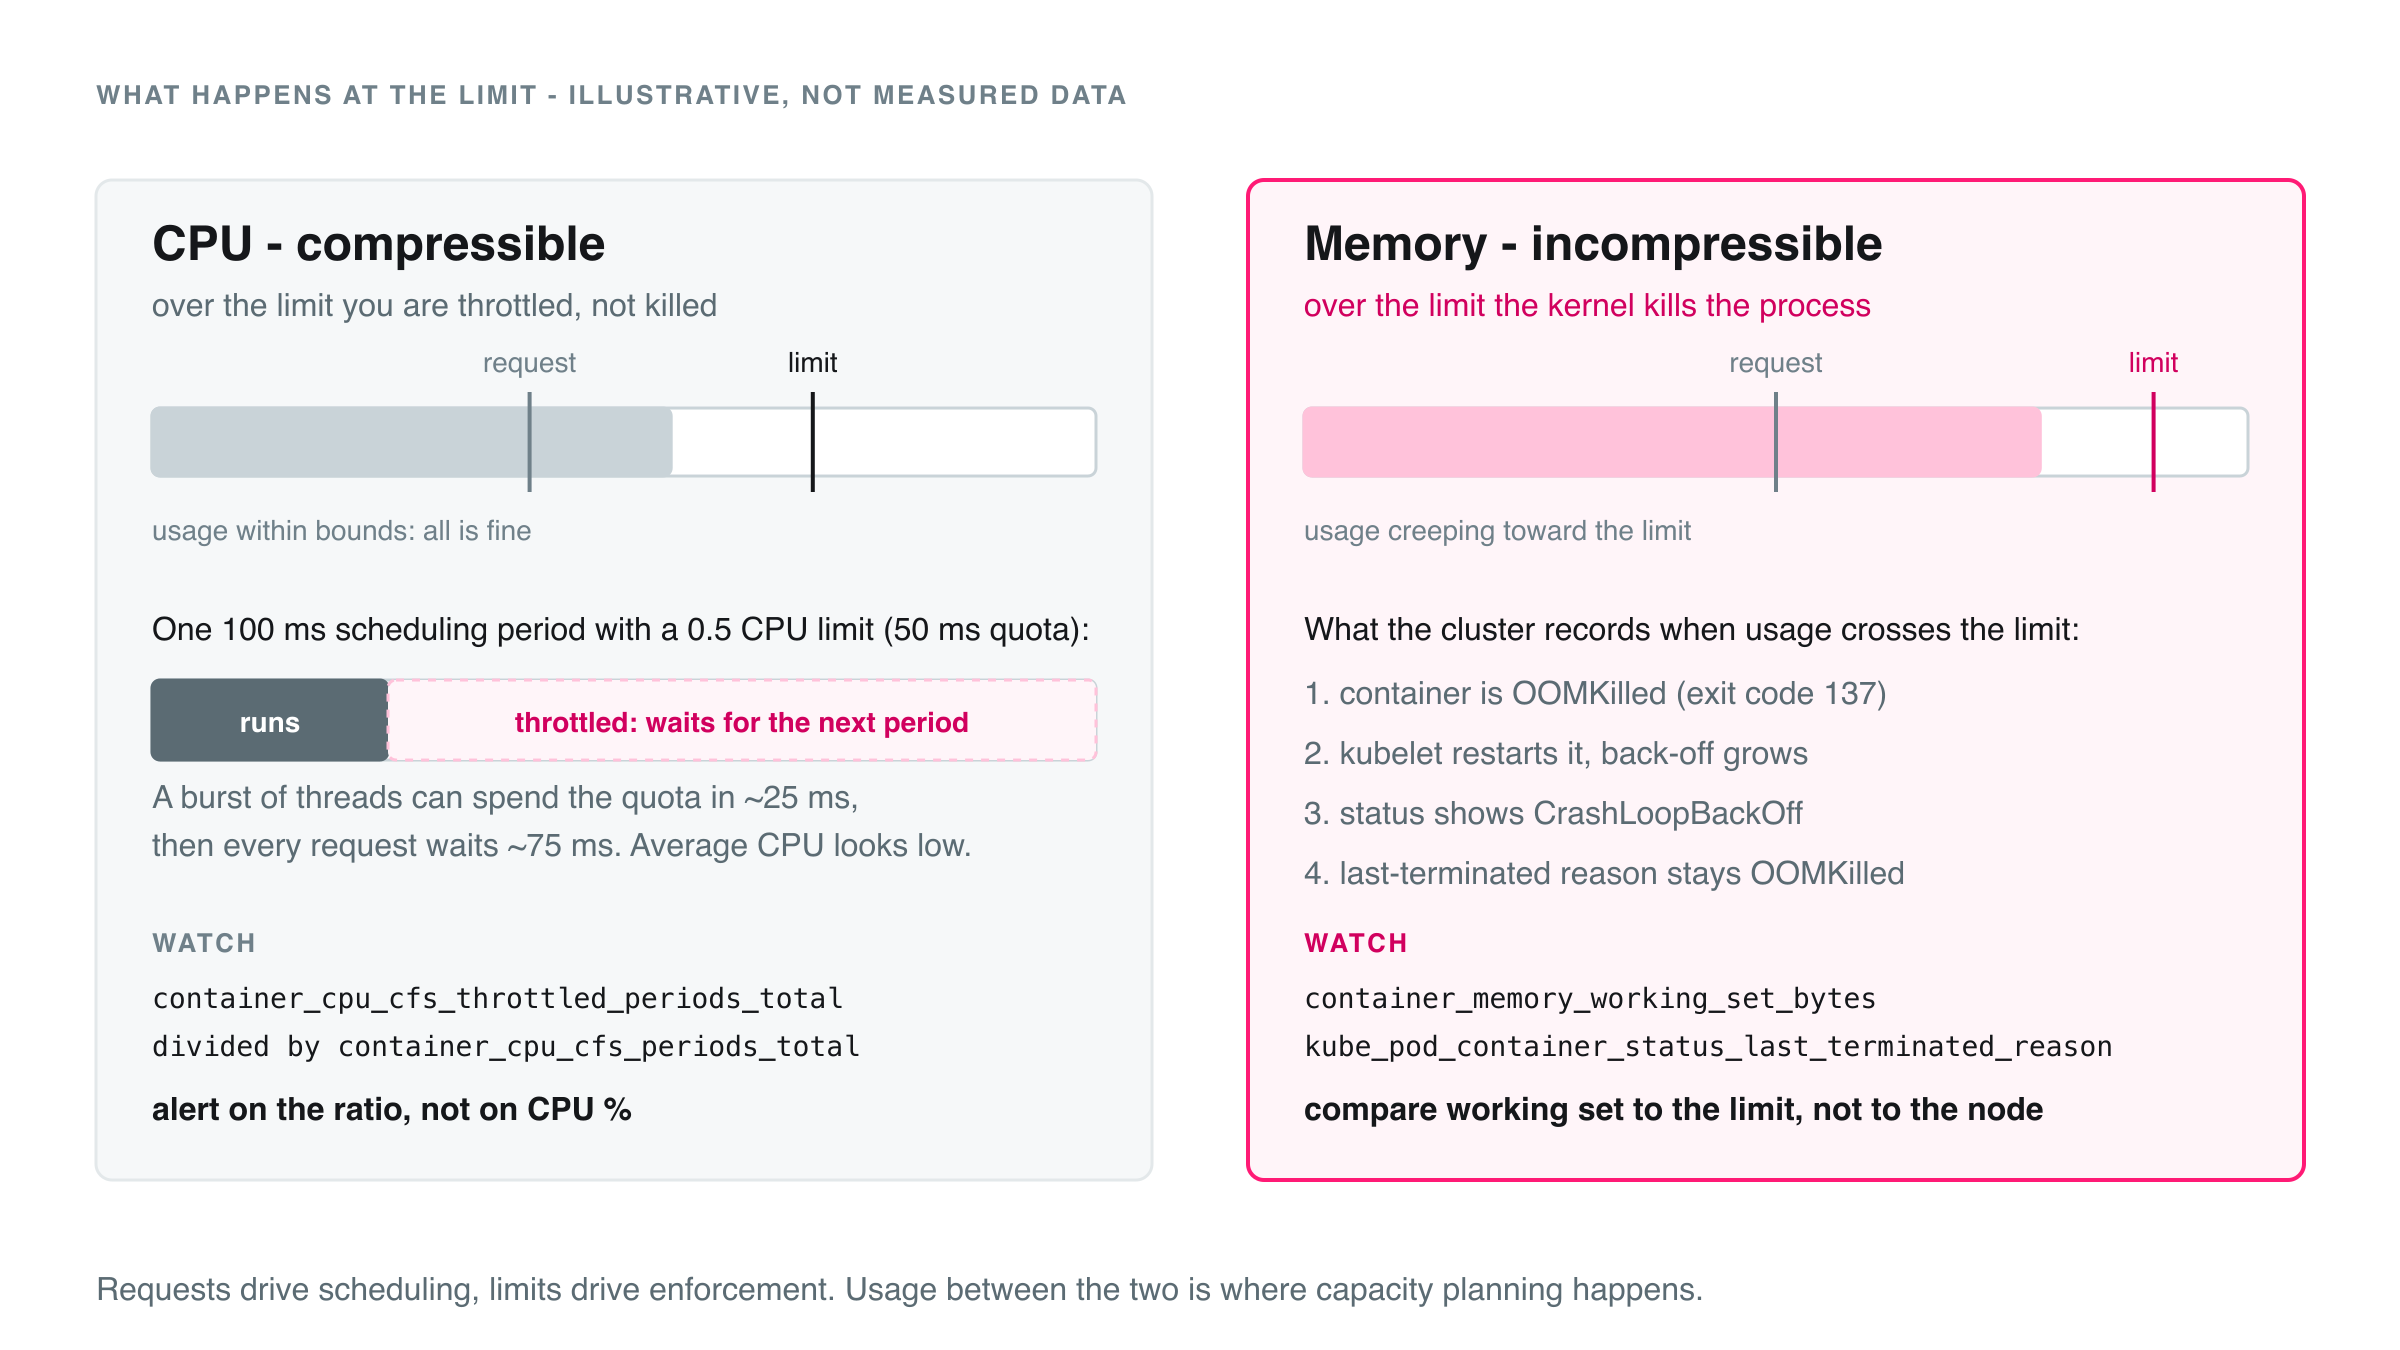
CPU is compressible, memory is not. A container at its CPU limit is paused for the rest of the 100 ms period, so a bursty service can spend much of every period frozen while average CPU looks harmless. Watch the throttled fraction rather than CPU percentage, and read it next to container PSI: waiting time shows starvation even where throttling does not. A container at its memory limit is killed (exit code 137, OOMKilled) and restarted with growing back-off, which becomes CrashLoopBackOff. Track the working set against the limit and alert on the last terminated reason, not only on restart counts.
Where the data comes from
- Metrics the application exposes, scraped by annotation-based autodiscovery (the community
prometheus.io/scrapestyle or a collector-specific annotation), by ServiceMonitor, PodMonitor and Probe objects from the Prometheus Operator ecosystem, or through ready-made integrations for databases and infrastructure (the reference implementation bundles PostgreSQL, MySQL, etcd and cert-manager, among others). - Logs. Containers write to stdout and stderr, the runtime stores the stream under
/var/log/pods/, and the kubelet rotates it (by default 10 MiB, five files). One DaemonSet reads every pod's files on its node. Write structured JSON, one event per line, with trace IDs, and never log secrets or personal data. - Traces. Instrument with OpenTelemetry SDKs, propagate the W3C
traceparentheader across every hop, and link metrics to traces with exemplars. Where you cannot instrument yet, use eBPF. Sampling is covered under Collector topology.
Pitfalls
- A liveness probe that is too aggressive restarts a slow but healthy service; a readiness probe that checks a shared dependency removes every replica at once.
- A missing request makes a pod the first candidate for eviction and defeats capacity planning.
- Unbounded labels (user IDs, request IDs, full URLs) in application metrics are the fastest way to a bad bill (see Cardinality and cost).
Networking across the layers
Networking is not a layer of its own; it runs through all five, and a denied or dropped packet looks like a timeout, so "the network" gets blamed first. The table maps network signals onto the stack; where a layer chapter already covers one, the last column says so.
| Layer | Signal | Metric or source | Why it matters |
|---|---|---|---|
| Hardware and kernel | TCP retransmits and resets | node_netstat_Tcp_RetransSegs, _Tcp_OutRsts, _TcpExt_TCPTimeouts | Packet loss shows here before applications time out. NIC drops and conntrack: Layer 1 |
| Nodes | NetworkPolicy drops | CNI drop counters; Cilium's Hubble hubble_drop_total by reason | A denied packet is a silent timeout. CNI health and kube-proxy: Layer 2 |
| Control plane | Client-side DNS | Application lookups versus CoreDNS query rate, NXDOMAIN ratio | Amplification hides in the gap. CoreDNS itself: Layer 3 |
| Cluster state | Service without ready endpoints | kube_endpoint_address{ready}, kube_endpoint_info; kube_endpointslice_endpoints{ready} | A Service with no backends drops traffic |
| Cluster state | LoadBalancer without an address | kube_service_spec_type{type="LoadBalancer"} without kube_service_status_load_balancer_ingress | The cloud integration or quota is failing |
| Workloads | Ingress or Gateway RED | Your controller's request, 5xx, latency and upstream-error metrics (names vary) | The user-facing symptom, per host and route |
| Workloads | TLS certificate expiry | certmanager_certificate_expiration_timestamp_seconds | Expiry is a scheduled outage |
| Any | Cross-zone traffic | Flow data with zone labels (eBPF, Hubble) | It costs money and latency |
Policy drops. Enforcement happens in the CNI, so the evidence is there too: Cilium counts drops by reason through Hubble (off by default), and other CNIs expose their own counters. Without them, "connection timed out" between two pods is a guessing game.
DNS from the client side. With the default ndots:5, a lookup of an external name first walks the cluster search domains, so one application lookup becomes several queries and a pile of NXDOMAIN answers. Watch the NXDOMAIN ratio and CoreDNS query rate against request rate. Mitigations: fully qualified names with a trailing dot, a lower ndots in the pod's dnsConfig, and NodeLocal DNSCache, a per-node cache that answers repeat lookups locally.
Endpoints. Endpoints are being superseded by EndpointSlices. In kube-state-metrics the kube_endpoint_* metrics are stable and the EndpointSlice ones experimental, and neither is in the reference default allow list, so add the one you use deliberately. If you run a service mesh, its proxies export golden metrics per workload pair and mTLS status, a useful optional source.
Part 2: How to collect
Collector topology
The collector bar in Figure 1 is not one thing. The usual pattern is an agent per node (a DaemonSet) for anything node-local, plus a gateway (a Deployment) for cluster-wide decisions: redaction, filtering, sampling, retries and fan-out. That is necessary but not sufficient.
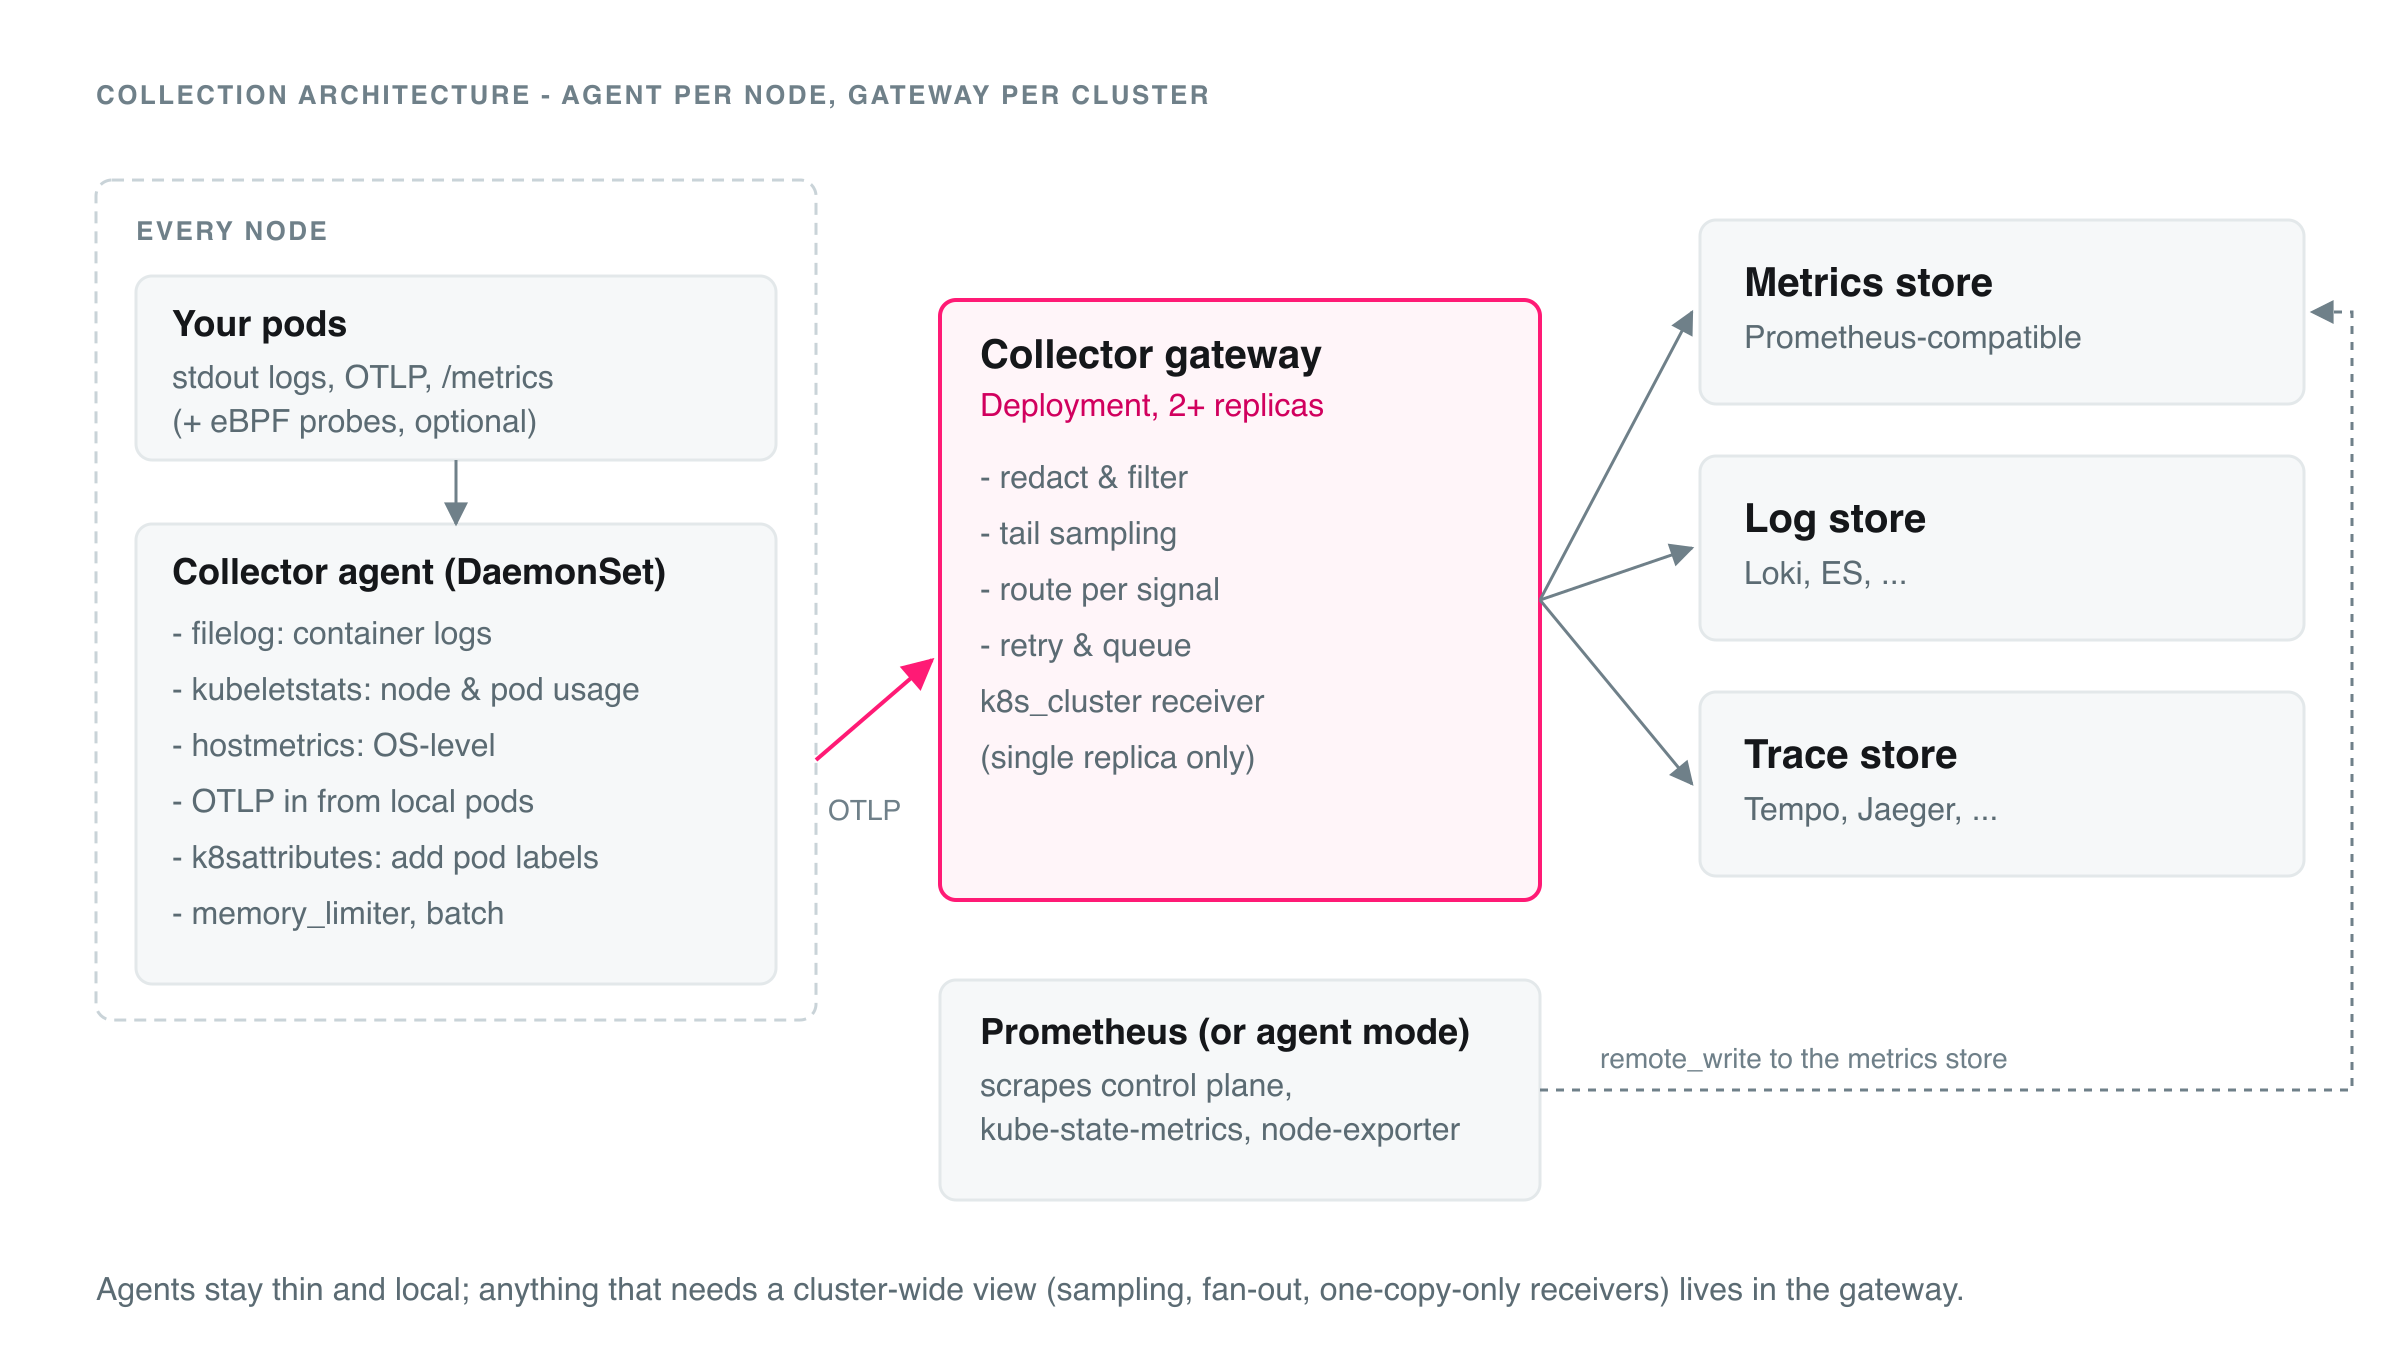
Three kinds of work do not fit "one agent per node":
- Cluster-wide scrape targets. The API server, scheduler, controller manager, CoreDNS, etcd and kube-state-metrics exist once per cluster. If every DaemonSet agent scrapes them you get N copies of each series. Scrape them with exactly one collector, or shard the targets across replicas: collector clustering, or the OpenTelemetry Target Allocator with the Operator.
- Events and cluster-level receivers. Kubernetes events and receivers such as
k8s_clusterare cluster-wide too; they need a singleton collector with one replica. - Tail sampling. A tail sampler decides after a trace completes, so all spans of a trace must reach the same sampler. Put trace-ID-aware load balancing (the
loadbalancingexporter) in front of the samplers.
The reference implementation (Grafana's k8s-monitoring Helm chart, a widely used one) runs collectors by role:
| Role | Shape | Collects | Why separate |
|---|---|---|---|
| Metrics | Clustered, scalable | Control plane, kubelet, cAdvisor, kube-state-metrics, annotated pods | Targets are sharded across replicas, so nothing is scraped twice |
| Logs | DaemonSet | Pod logs, node journal | Needs host files on every node |
| Receiver | Deployment or DaemonSet | OTLP from applications | Scales with traffic, not with nodes |
| Singleton | One replica | Cluster events | Cluster-wide, must not be duplicated |
| Profiles | DaemonSet | Profiling data | Node-local, needs privileges |
| Sampler (optional) | Deployment behind a load balancer | Tail-sampled traces | Trace-ID routing to one sampler per trace |
You can reach the same shape with plain OpenTelemetry Collectors or with Prometheus doing the scraping. The point is the roles, not the product. And if the platform already ships Prometheus, kube-state-metrics and node-exporter (OpenShift, Rancher Monitoring, KKP), tap or remote-write from that stack instead of collecting twice.
An agent configuration sketch
receivers:
  otlp:
    protocols: { grpc: {}, http: {} }
  kubeletstats:
    collection_interval: 30s
    auth_type: serviceAccount
    endpoint: "https://${env:K8S_NODE_NAME}:10250"
    insecure_skip_verify: true          # kubelet certs are often self-signed; prefer a real CA
  hostmetrics:
    collection_interval: 30s
    scrapers: { cpu: {}, memory: {}, filesystem: {}, network: {}, load: {} }
  filelog:
    include: [ /var/log/pods/*/*/*.log ]
    exclude: [ /var/log/pods/observability_*/*/*.log ]   # not the collector itself
    include_file_path: true
    operators:
      - type: container                 # containerd / CRI-O / Docker log formats

processors:
  memory_limiter: { check_interval: 1s, limit_percentage: 80, spike_limit_percentage: 25 }
  k8sattributes: {}                     # configured in the next chapter
  batch: {}

exporters:
  otlp:
    endpoint: otel-gateway.observability.svc:4317
    tls: { insecure: true }             # in-cluster; use mTLS if your policy requires it

service:
  pipelines:
    metrics: { receivers: [ otlp, kubeletstats, hostmetrics ], processors: [ memory_limiter, k8sattributes, batch ], exporters: [ otlp ] }
    logs:    { receivers: [ otlp, filelog ],                   processors: [ memory_limiter, k8sattributes, batch ], exporters: [ otlp ] }
    traces:  { receivers: [ otlp ],                            processors: [ memory_limiter, k8sattributes, batch ], exporters: [ otlp ] }
The agent needs the node name as an environment variable (downward API field spec.nodeName). Monitor the monitor: scrape the Collector's own metrics (queue size, failed exports, refused data), alert on scrape targets that are down, and add a watchdog alert that always fires, so that silence at your pager means the alert chain is broken.
Adding Kubernetes context with k8sattributes
A question in almost every first dashboard: "I can see CPU per pod, but how do I see it per Deployment?" The answer is not in the metric itself.
The problem
The kubeletstats receiver emits usage with a few resource attributes: k8s.pod.uid, k8s.pod.name and k8s.namespace.name. The kubelet does not know which Deployment, StatefulSet or CronJob created the pod, so k8s.deployment.name does not exist yet. The k8sattributes processor adds it.
How it works
- It watches Pods (and, where needed, ReplicaSets) through the API and keeps a local cache.
- Association decides which pod a data point belongs to, using ordered
pod_associationrules: for kubelet metrics match on the resource attributek8s.pod.uid; for OTLP from applications fall back to the connection source IP. With no rules the processor associates by connection IP only, which is why kubelet metrics need an explicit rule. - Owner resolution follows Pod, ReplicaSet, Deployment. Per the processor's documentation the Deployment name is derived from the ReplicaSet name by trimming the pod-template hash, and you must list
k8s.deployment.nameinextract.metadatafor it to be written. The same mechanism gives StatefulSet, DaemonSet, CronJob and node names, plus selected labels and annotations.
processors:
  k8sattributes:
    auth_type: serviceAccount
    filter:
      node_from_env_var: K8S_NODE_NAME  # only pods on this node
    extract:
      metadata: [ k8s.namespace.name, k8s.pod.name, k8s.pod.uid,
                  k8s.deployment.name, k8s.statefulset.name, k8s.daemonset.name,
                  k8s.node.name ]
      labels:
        - tag_name: app
          key: app.kubernetes.io/name
          from: pod
    pod_association:
      - sources: [ { from: resource_attribute, name: k8s.pod.uid } ]   # kubelet metrics
      - sources: [ { from: connection } ]                              # OTLP from apps
This is a sketch of the attribute flow; check it against the current README of the k8sattributesprocessor.
RBAC: the usual pitfall
rules:
  - apiGroups: [""]
    resources: ["pods", "namespaces", "nodes"]
    verbs: ["get", "list", "watch"]
  - apiGroups: ["apps"]
    resources: ["replicasets"]
    verbs: ["get", "list", "watch"]
Incomplete RBAC does not break the pipeline; it leaves attributes missing, and the only evidence is "forbidden" errors in the collector log. If k8s.deployment.name is empty, check the replicasets permission and that the attribute is in extract.metadata. Make "every pod metric carries a workload owner name" a check you run after each change to the collector or its RBAC.
Association keys are not export keys
k8s.pod.uid is the ideal key for association and a poor one to keep: it changes with every pod. Associate with it, then remove it before export, together with other high-churn attributes. The reference implementation ships a default remove list: process.pid, process.parent_pid, process.executable.path, process.command_line, process.command_args, process.owner, process.runtime.version, process.runtime.description, host.ip, host.mac, k8s.pod.start_time, k8s.pod.uid, container.image.id, container.image.repo_digests, os.description and os.build_id. Do it once, after enrichment and before the last export hop:
processors:
  resource/drop_noisy:
    attributes:
      - { key: k8s.pod.uid, action: delete }
      - { key: process.pid, action: delete }
      - { key: process.command_line, action: delete }
      - { key: container.image.id, action: delete }
Resource attributes are not metric labels
Even with the attribute present you may not find it when you query. Resource attributes describe where data came from; Prometheus labels are what you filter and group by. With the Prometheus and remote write exporters, resource attributes by default land only in a target_info metric, to be joined at query time. resource_to_telemetry_conversion: { enabled: true } turns all of them into labels on every series, which works and costs cardinality. With OTLP-native ingestion, Prometheus 3.x can promote a chosen list (promote_resource_attributes under otlp) and Grafana Mimir has a similar option (-distributor.otel-promote-resource-attributes, experimental at the time of writing); the transform processor can also copy just what you need. Promote only what you filter by, typically namespace, deployment and node, and verify option names against your version.
The pure Prometheus way
Without OpenTelemetry there is no deployment label on cAdvisor metrics. You join at query time with kube-state-metrics: kube_pod_owner maps pods to ReplicaSets and kube_replicaset_owner maps ReplicaSets to Deployments.
sum by (namespace, deployment) (
  sum by (namespace, replicaset) (
      sum by (namespace, pod) (rate(container_cpu_usage_seconds_total{container!=""}[5m]))
    * on (namespace, pod) group_left (replicaset)
      label_replace(kube_pod_owner{owner_kind="ReplicaSet"}, "replicaset", "$1", "owner_name", "(.+)")
  )
  * on (namespace, replicaset) group_left (deployment)
    label_replace(kube_replicaset_owner{owner_kind="Deployment"}, "deployment", "$1", "owner_name", "(.+)")
)
It works, but you write, maintain and pay for the join on every query. Enriching once in the collector moves that cost to ingestion; your promotion choices then fix the label set.
eBPF auto-instrumentation and profiling
eBPF lets small, verified programs run inside the Linux kernel and attach to user-space library functions (uprobes), kernel functions and system calls (kprobes), and the network path. An agent that loads them sees every process on the node without changing any of them. In Kubernetes that maps onto a DaemonSet: one agent per node, no sidecars, no restarts. Note the twist that puts it here and not in a layer chapter: eBPF runs at the infrastructure layer but delivers application-level telemetry, APM without code changes. It is collected at the bottom and used at the top.
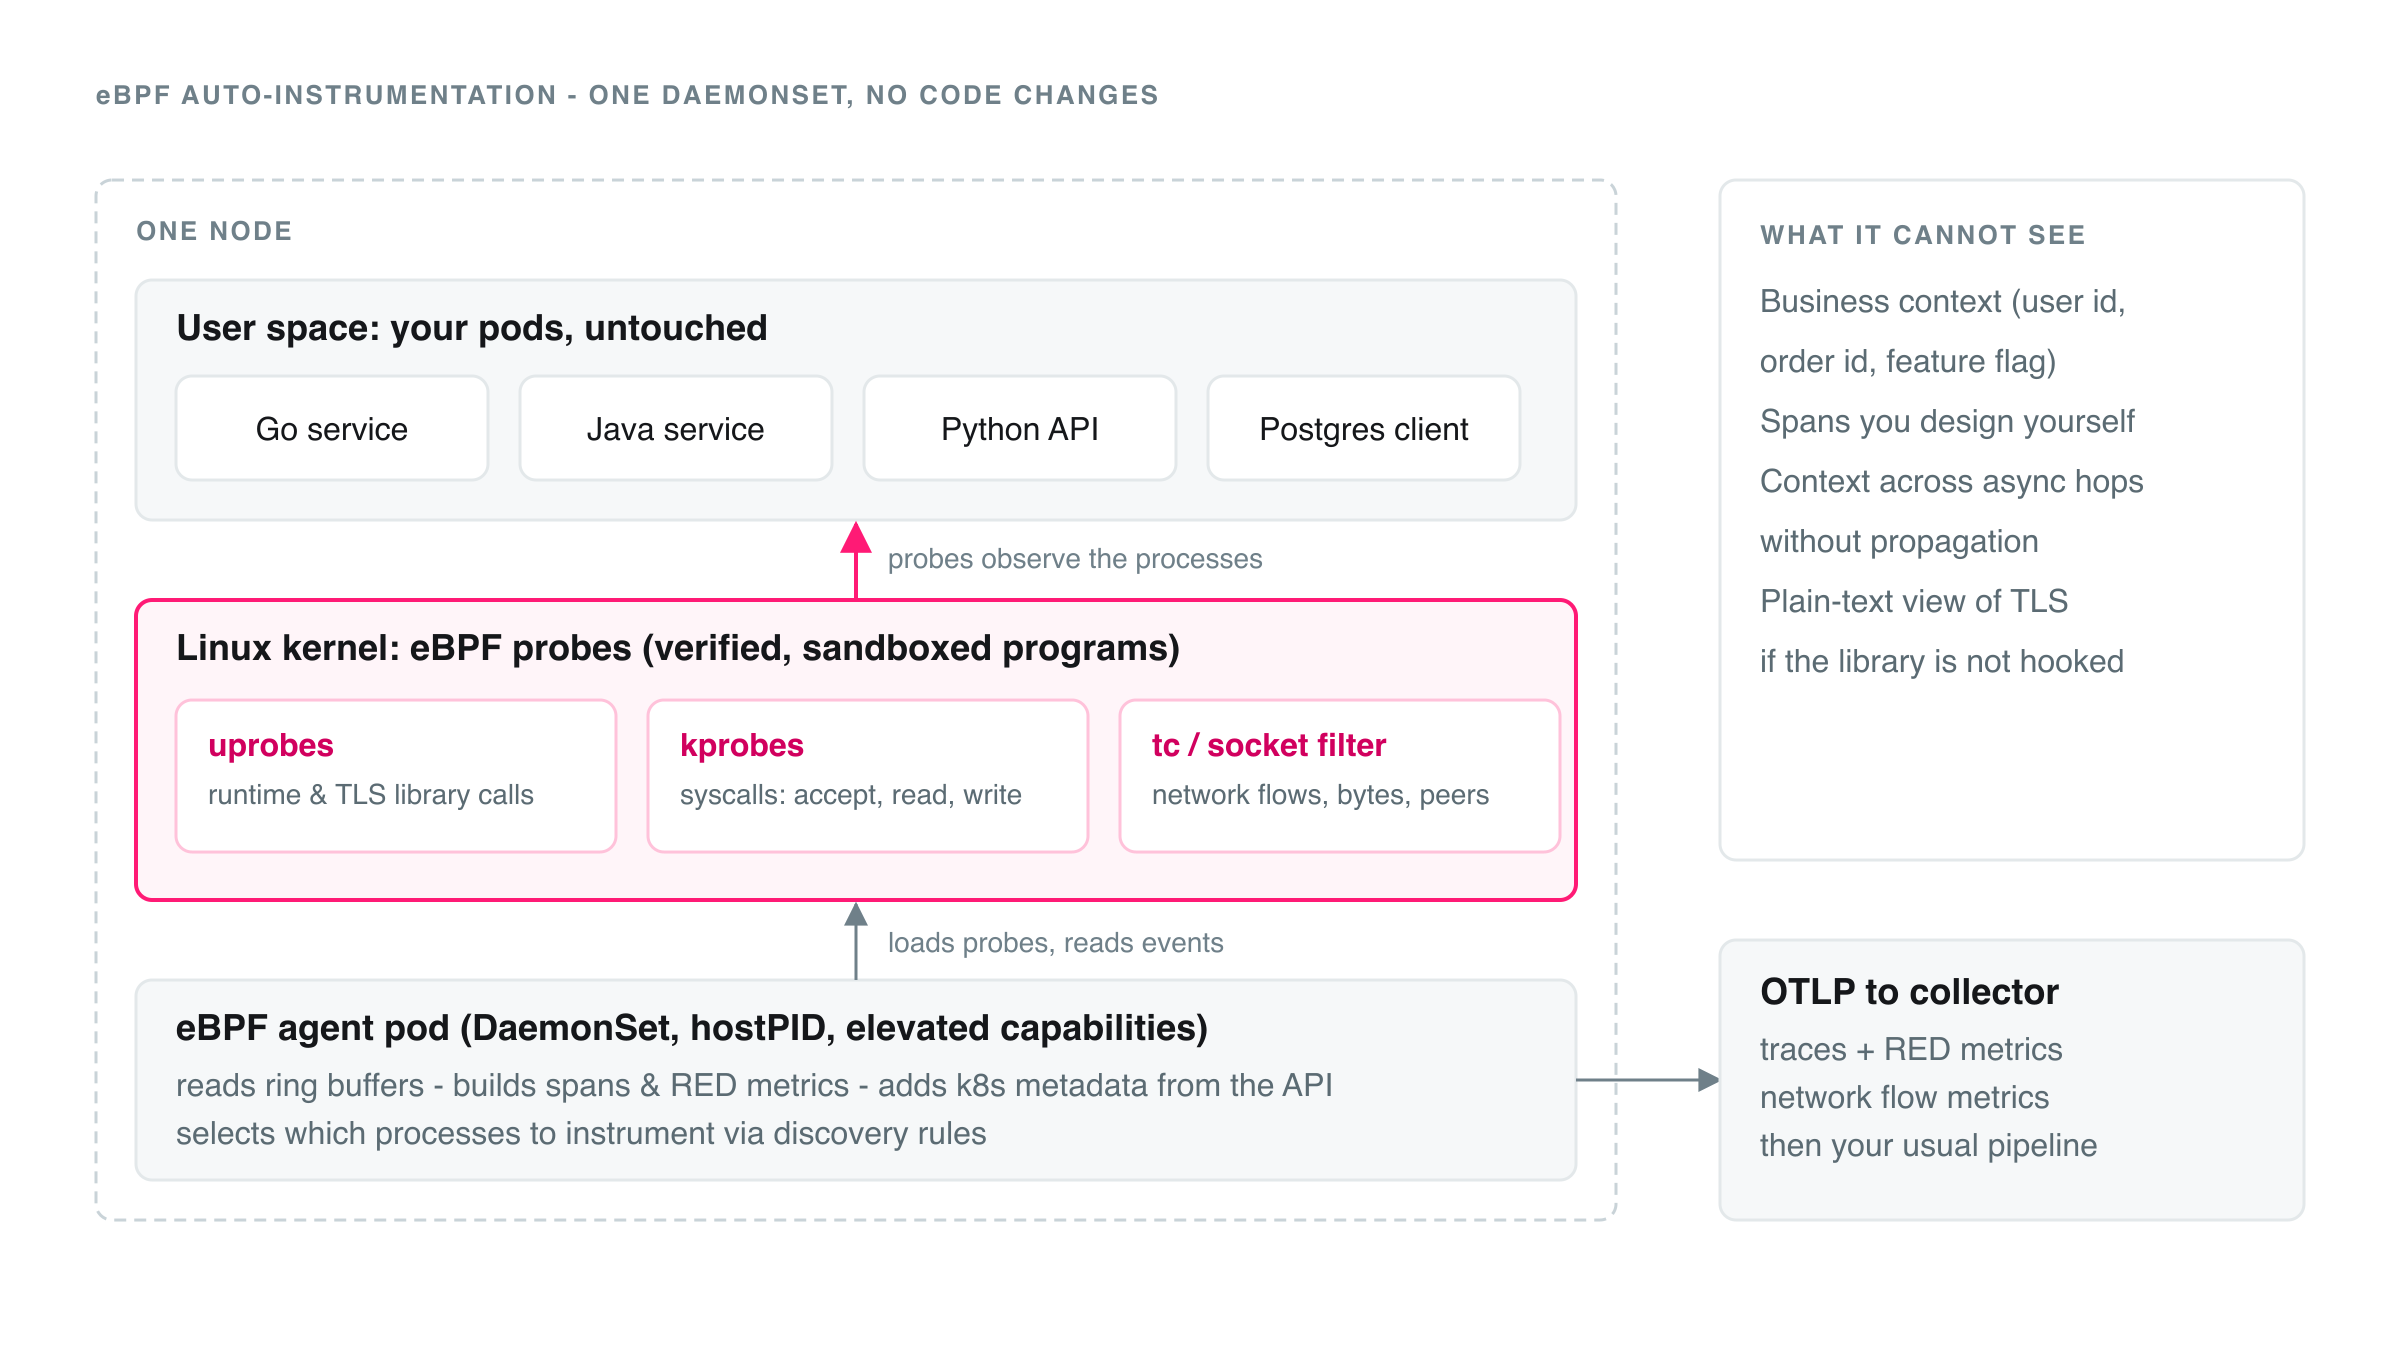
What you get
- Zero-code traces and RED metrics for HTTP, HTTP/2, gRPC and common data stores and brokers (the OpenTelemetry eBPF project lists PostgreSQL, MySQL, Redis, MongoDB, Kafka and others), across Go, Java, Python, Node.js, .NET, Rust and C/C++.
- Network flows: who talks to whom, between which pods, services and nodes; the quickest service map of a cluster you did not build.
- Continuous profiling as a fourth signal. Profiles (where CPU time goes, as flame graphs) join metrics, logs and traces. eBPF profilers sample stack traces across the node without code changes; Parca and Grafana Pyroscope are the open source options, and the reference implementation also supports Java and pprof profiling.
The main open source tools: OpenTelemetry eBPF Instrumentation (OBI), upstream zero-code auto-instrumentation that grew out of Grafana Beyla (its documentation lists a 0.x release at the time of writing, so pin versions); Cilium Hubble for network flows on Cilium clusters; Pixie, a CNCF sandbox project that keeps captured requests in the cluster; Parca and Pyroscope for profiling; Tetragon for runtime security.
Requirements: kernel and privileges
For OBI the documentation states Linux 5.8 or newer with BTF (Red Hat family kernels at 4.18 with backports also work), on amd64 or arm64; network-level trace context propagation is documented as needing 5.17 or newer. The agent needs CAP_BPF and, depending on features and host settings, CAP_PERFMON (or CAP_SYS_ADMIN where perf_event_paranoid is restrictive), CAP_SYS_PTRACE, CAP_NET_RAW and a few more, plus hostPID: true. The simplest manifest runs the container privileged; a tighter one lists only the capabilities required. Expect a Pod Security exception for its namespace, expect serverless node pools (Fargate or Autopilot-style) to rule it out, and on OpenShift expect to need a security context constraint that allows privileged, hostPath and hostNetwork. Treat the agent as a high-value target: pin and scan the image and restrict who can edit the DaemonSet.
A DaemonSet sketch
The sketch follows the shape of the upstream OBI Kubernetes example. Treat it as a starting point: pin the version, read the upstream documentation, and verify on a test cluster. It also needs a ServiceAccount whose role can list and watch pods, services, nodes and ReplicaSets, for Kubernetes metadata.
apiVersion: apps/v1
kind: DaemonSet
metadata: { name: obi, namespace: observability }
spec:
  selector: { matchLabels: { app: obi } }
  template:
    metadata: { labels: { app: obi } }
    spec:
      serviceAccountName: obi
      hostPID: true                     # see processes on the host
      containers:
        - name: obi
          image: otel/ebpf-instrument:<pinned-version>
          securityContext:
            privileged: true            # or: a capability list, see text
          env:
            - name: OTEL_EBPF_AUTO_TARGET_EXE        # which executables to instrument
              value: "*/my-service"
            - name: OTEL_EBPF_KUBE_METADATA_ENABLE   # add pod, namespace, node attributes
              value: "true"
            - name: OTEL_EXPORTER_OTLP_ENDPOINT      # the collector, not a backend
              value: "http://otel-agent.observability:4318"
Point the agent at your local collector, not at a backend, and select services explicitly rather than "everything".
Operations and limits
- A central metadata cache. If every DaemonSet pod watches the API for pod metadata, a large cluster pays for it N times. The reference implementation deploys a separate Kubernetes cache Deployment for its eBPF agents (default starting point: one replica per 50 nodes).
- hostNetwork port conflicts. Some eBPF agents run with
hostNetwork: trueand bind a port on every node; two such DaemonSets, or an unrelated workload on the same host port, collide. Plan ports like a shared resource. - Overhead is workload-specific and we quote no number: measure the agent's CPU and memory per node, and the effect on your busiest service, before a full rollout.
- Blind spots. Encrypted traffic is visible only where probes hook the library that handles it (common TLS libraries, Go's crypto/tls). Linking calls into one trace needs trace context in the requests: the agent can read an existing
traceparent, creating one needs the more privileged propagation features, and asynchronous hops remain hard. It cannot know the customer, order or feature flag behind a request. Use eBPF for baseline coverage and a service map, SDKs where context pays off; both speak OTLP. - Configure route patterns so
/orders/123becomes/orders/{id}, and test the agent with every node image upgrade. For an earlier generation of auto-instrumentation see Application observability: tracing with auto-instrumentation.
Cardinality and cost
Every unique label combination is a new time series, and Kubernetes churns identifiers: every rollout creates new pod names. Cardinality is the most common reason a monitoring bill or backend falls over, so give it a budget from day one:
- Never use unbounded values as labels: user IDs, request IDs, full URLs, raw error messages. Prefer stable identities (deployment, service) over ephemeral ones (pod UID), and remove churning resource attributes before export.
- Allow-list what you use at the edge, set a series budget per team or namespace, and include or exclude whole namespaces per source. Recording rules turn expensive queries into cheap ones; advanced Prometheus querying shows patterns for awkward data.
The minimum metric set
Allow lists are the most effective cost lever. This table is the one place that names the must-have series, per source; the layer chapters explain why each matters. It draws on the reference implementation's deliberately minimal defaults (cAdvisor 19 metrics, kube-state-metrics 43 patterns, kubelet 36, node-exporter 10) and on a keep-regex from a real setup: writing the minimum as a keep-regex is how you enforce it.
| Source | Must-have metrics | Collected by | Note |
|---|---|---|---|
| node-exporter | node_cpu_seconds_total, node_memory_MemTotal_bytes and _MemAvailable_bytes, node_filesystem_size_bytes and _avail_bytes, node_disk_io_time_seconds_total, node_network_{receive,transmit}_{bytes,drop}_total, node_nf_conntrack_entries and _limit, node_netstat_Tcp_RetransSegs, node_pressure_* | node-exporter, or the Collector's hostmetrics receiver | The reference default keeps 10 patterns (no conntrack, netstat or PSI): add them. Prefer _avail_bytes to _free_bytes: free includes root-reserved blocks, avail is what workloads can use. node_cpu_core_throttles_total is hardware (thermal) throttling from the cpu collector, not container CFS throttling. instance_device:node_disk_io_time_seconds:rate1m is a recording rule from the node-mixin, present only if its rules are loaded; the raw metric is node_disk_io_time_seconds_total. hostmetrics uses system.* names and may not cover all of these. |
| kubelet | kubelet_pleg_relist_duration_seconds, kubelet_pod_start_duration_seconds, kubelet_runtime_operations_errors_total, kubelet_volume_stats_used_bytes, _capacity_bytes, _available_bytes, _inodes, _inodes_used | Scrape of the kubelet's /metrics; kubeletstats receiver for volumes | Volume series exist only if the CSI driver implements NodeGetVolumeStats; otherwise they silently do not exist. The kubeletstats equivalents are k8s.volume.available, capacity, inodes, inodes.free, inodes.used. |
| cAdvisor | The 19 series below, plus container_cpu_cfs_throttled_seconds_total, machine_cpu_cores and the six container_pressure_* PSI series | Scrape of the kubelet's /metrics/cadvisor | container_memory_usage_bytes includes page cache; the OOM killer acts on container_memory_working_set_bytes. PSI is opt-in, see below. |
| kube-state-metrics | kube_deployment_spec_replicas and kube_deployment_status_replicas_{available,ready,unavailable}, kube_pod_status_phase, kube_pod_container_status_*, kube_pod_owner, kube_node_status_*, kube_pod_container_resource_requests and _limits, kube_persistentvolumeclaim_status_phase, kube_horizontalpodautoscaler_*, kube_resourcequota, kube_namespace_created, kube_job_status_failed | Scrape, by exactly one collector | Labels need an explicit allow list. |
| Control plane | apiserver_request_total and _duration_seconds; etcd_server_has_leader, etcd_server_leader_changes_seen_total, etcd_disk_backend_commit_duration_seconds and etcd_disk_wal_fsync_duration_seconds; scheduler_pending_pods; workqueue_depth, workqueue_queue_duration_seconds | Scrape (off by default in the reference; etcd on its own port) | Hosted platforms expose only part (Layer 3). |
| CoreDNS | coredns_dns_request_duration_seconds, coredns_dns_responses_total (by rcode) | Scrape | Add the cache hit ratio if you tune DNS. |
| Collection | up (per-target scrape health); optionally prometheus_operator_ready | Scrape | The basis of "scrape target down". The operator metric only matters if you run the Prometheus Operator. |
| Events (not metrics) | Warning reasons: FailedScheduling, BackOff, Unhealthy, FailedMount, FailedAttachVolume, Evicted, FailedCreatePodSandBox, NodeNotReady; OOMKilling if node-problem-detector runs | k8sobjects receiver, watch mode, singleton | Repeats arrive as one Event with a count. OOMKilling comes from node-problem-detector's kernel monitor, not from Kubernetes itself. |
The 19 cAdvisor series the reference implementation keeps by default, a good starting budget:
container_cpu_cfs_periods_total          container_memory_cache
container_cpu_cfs_throttled_periods_total container_memory_rss
container_cpu_usage_seconds_total        container_memory_swap
container_fs_reads_bytes_total           container_memory_usage_bytes
container_fs_reads_total                 container_memory_working_set_bytes
container_fs_writes_bytes_total          container_network_receive_bytes_total
container_fs_writes_total                container_network_receive_packets_dropped_total
container_network_receive_packets_total  container_network_transmit_bytes_total
container_network_transmit_packets_dropped_total
container_network_transmit_packets_total  machine_memory_bytes
Container PSI. Pressure Stall Information measures the time tasks lose waiting for a resource, which usage and throttling counters cannot show. Six series: container_pressure_cpu_waiting_seconds_total, container_pressure_cpu_stalled_seconds_total, and the same two for memory and for I/O. Waiting is the kernel's "some" (at least one task stalled), stalled is "full" (all non-idle tasks stalled). CPU waiting is a better "is this container starved" signal than the throttling ratio alone, memory stalled warns before an OOM kill, and I/O stalled catches noisy neighbours on a disk. They are not in the reference default allow list, so you opt in. Per the Kubernetes documentation they need the kubelet's PSI support (the KubeletPSI feature gate: alpha in 1.33, beta in 1.34, stable and locked on in 1.36; check your version), cgroup v2, and a kernel with PSI enabled (4.20 or newer; some distributions need psi=1 on the kernel command line). Two cautions: they are per container, so mind the cardinality, and a node without PSI can report zeros rather than nothing, so zero is not proof of health.
Optional extras. OpenCost turns usage and prices into cost allocation by namespace and workload, and Kepler estimates energy use per node and pod; both are separate exporters with their own allow lists.
Part 3: Alert, plan and act
Alerting
Alert on symptoms and diagnose with causes: pages come almost only from application observability (user-facing symptoms, SLO burn), while the causes sit in platform and infrastructure observability, on dashboards and in tickets. Layer 3 pages only for an API server that is down or erroring, or an etcd without a leader, and disk and capacity alerts should be predictive (predict_linear), so that you fix them in daylight. The table is a curated subset in paging order, with the three tiers of Figure 7. For the long tail start from the kubernetes-mixin, the de facto standard rule set behind kube-prometheus; the reference implementation ships no alert rules, it only syncs PrometheusRule objects.
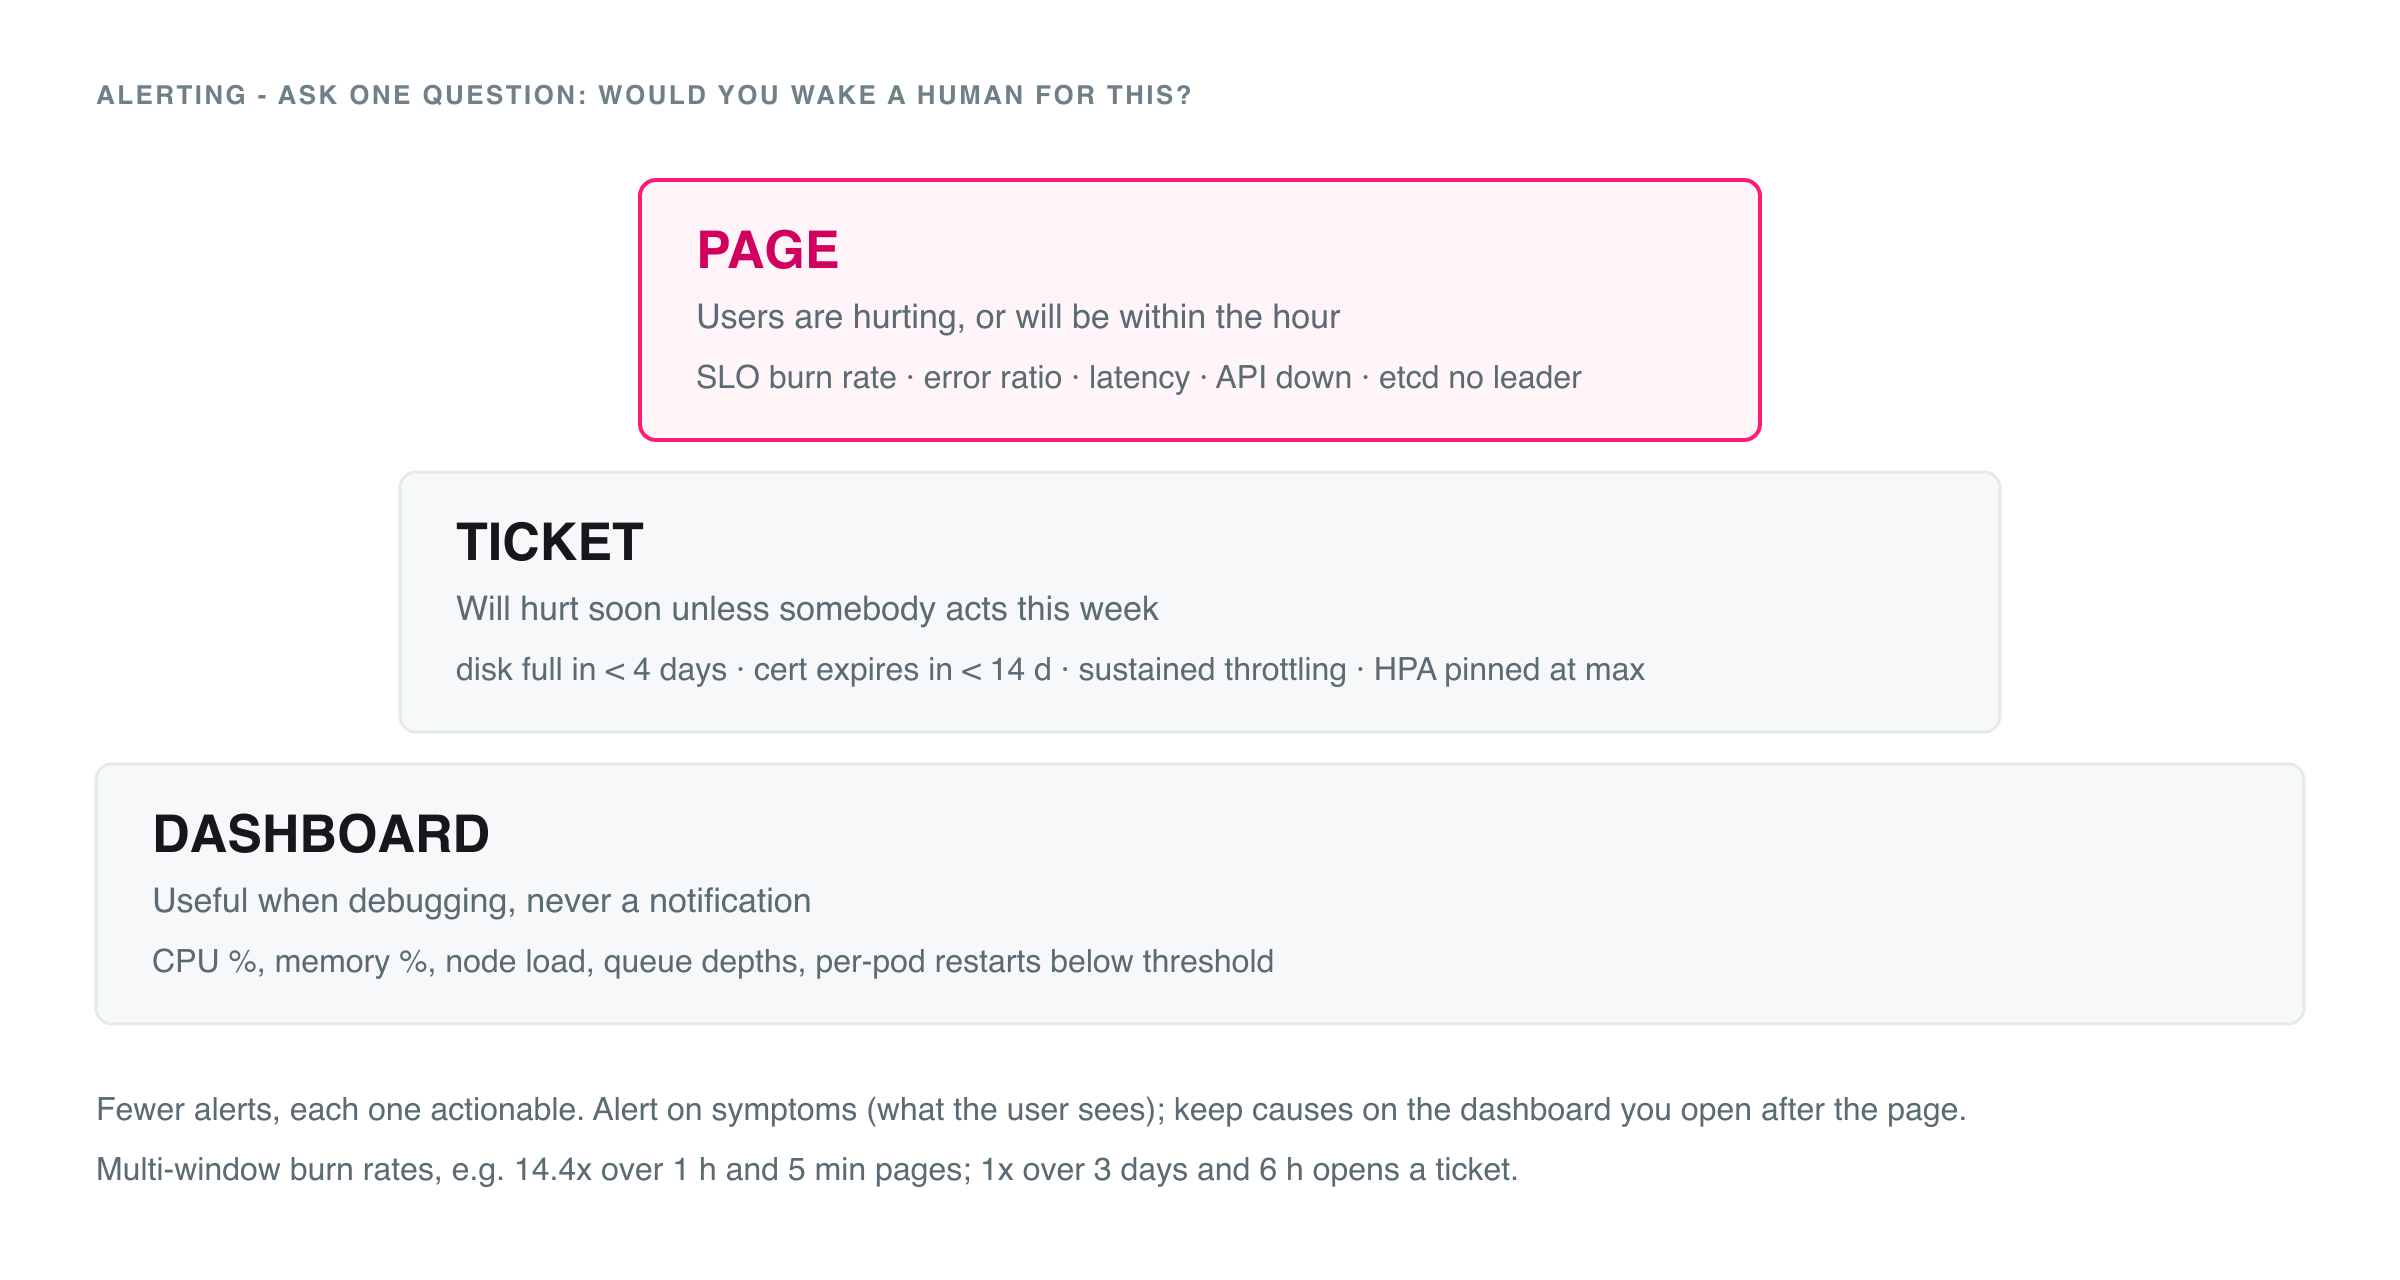
| Alert | Expression (short) | Tier | For |
|---|---|---|---|
| Layer 5: Workloads | |||
| SLO fast burn | Error ratio above 14.4x the budget over 1h and 5m (99.9% SLO) | Page | - |
| SLO slow burn | Above 3x over 1d and 2h | Ticket | - |
| Crash loop or OOM kill | Waiting reason CrashLoopBackOff, or restarts with last terminated reason OOMKilled | Ticket | 15m |
| CPU throttling ratio | rate(cfs_throttled_periods) / rate(cfs_periods) > 0.25 | Dashboard | - |
| Layer 4: Cluster state | |||
| Deployment not available | Spec replicas differ from available replicas | Ticket | 15m |
| Pods stuck Pending | kube_pod_status_phase{phase="Pending"} > 0 | Ticket | 15m |
| HPA pinned at maximum, Job failed | Current replicas equal max replicas; kube_job_status_failed > 0 | Ticket | 15m |
| Repeated FailedMount or FailedCreatePodSandBox | Warning events with that reason, count rising for the same object | Ticket | 15m |
| Warning events | Warning events per reason and namespace | Dashboard | - |
| Layer 3: Control plane | |||
| API server down or erroring | up{job="apiserver"} == 0, or 5xx ratio above 1% | Page | 2-10m |
| etcd without leader | etcd_server_has_leader == 0 | Page | 1m |
| etcd slow disk or leader churn | WAL fsync p99 above 10 ms; over 3 leader changes per hour | Ticket | 10m |
| Certificates expiring | API server client certificate expiry under 7 days | Ticket | - |
| Unexpected deletes | Audit-log query: delete on Deployments or Namespaces in production by an unexpected user | Ticket | - |
| API latency, queues, scheduler | Request p99 per verb, workqueue_depth, scheduler_pending_pods | Dashboard | - |
| Layer 2: Nodes | |||
| Node not ready or under pressure (page if several) | Ready false, or a pressure condition true | Ticket | 10m |
| Volume filling up | predict_linear(kubelet_volume_stats_available_bytes[6h], 4*86400) < 0 | Ticket | - |
| Sustained container memory stall | rate(container_pressure_memory_stalled_seconds_total[5m]) above a small fraction (for example 0.05) | Ticket | 15m |
| Container CPU or I/O pressure, kubelet health | PSI waiting rates; PLEG relist p99, pod start p99, runtime errors | Dashboard | - |
| Layer 1: Hardware and kernel | |||
| Disk or inodes filling | predict_linear(node_filesystem_avail_bytes[6h], 4*86400) < 0, same for files_free | Ticket | 1h |
| Conntrack nearly full | Entries over 80% of the limit | Ticket | 10m |
| Per-node CPU, memory, I/O | Utilization and pressure per node | Dashboard | - |
| Networking | |||
| Service without ready endpoints (production) | kube_endpoint_info unless on(namespace,endpoint) kube_endpoint_address{ready="true"} | Page | 5m |
| Ingress 5xx ratio (Ticket unless it is the user-facing SLO) | 5xx over all requests per host above 1%; names vary by controller | Page | 10m |
| Certificate expires in under 14 days | certmanager_certificate_expiration_timestamp_seconds - time() < 14*86400 | Ticket | - |
| CoreDNS failures | SERVFAIL ratio above 1% | Ticket | 10m |
| TCP retransmits, policy drops, cross-zone flows | node_netstat_Tcp_RetransSegs rate, hubble_drop_total by reason | Dashboard | - |
| Capacity | |||
| Requests commitment above 80% | Requests of running pods over allocatable, cpu or memory | Ticket | 1h |
| No N+1 headroom | Requests over (allocatable minus the largest node) above 1 | Ticket | 1h |
| ResourceQuota above 90% | Used over hard, kube_resourcequota | Ticket | 15m |
| Pods per node above 90% | Running pods over allocatable pods per node | Ticket | - |
| PVC above 85% used | kubelet_volume_stats_used_bytes / kubelet_volume_stats_capacity_bytes > 0.85 | Ticket | 15m |
| Limits overcommit, waste | Limits over allocatable; requests versus real usage | Dashboard | - |
| Collection | |||
| Scrape target down | up == 0 | Ticket | 10m |
| Collector refusing, failing or queueing data | otelcol_receiver_refused_*, otelcol_exporter_send_failed_*, queue over 80% of capacity | Ticket | 10m |
| Watchdog (pages when it goes silent) | vector(1), always firing | Page | - |
Rules of the road: every alert has an owner, a runbook link and an action; use for: durations and inhibition so that forty pod alerts do not fire when their node is down; route by a team or namespace label; review monthly and delete or demote what nobody acted on. Collector metric names vary with the version, so check yours.
Capacity and headroom
What it is
Running out of capacity rarely announces itself. The scheduler places pods by requests, not by usage, so a cluster can be full while its CPUs sit idle, and the result is Pending pods, stalled rollouts, or a node loss that takes workloads down. Capacity monitoring answers three questions: how much more can be placed, how much is wasted, and what happens when a node or zone fails.
Key signals
| Signal | Metric example | Why it matters |
|---|---|---|
| Allocatable versus capacity | kube_node_status_allocatable versus _capacity (cpu, memory, pods, ephemeral_storage) | kube-reserved, system-reserved and the eviction threshold sit in between; plan on allocatable |
| Requests commitment | Requests of running pods over allocatable, per node and cluster | The key number: what the scheduler considers full |
| Limits overcommit and waste | Limits over allocatable; requests versus real usage over days | Throttling and OOM risk if everything bursts; money wasted |
| N+1 headroom | Requests versus allocatable minus the largest node or zone | Whether the rest can absorb a failure |
| Pod, IP and storage limits | kube_node_status_allocatable{resource="pods"} versus running pods; CNI address pools; ephemeral storage | Nodes can be "full" on pods or addresses before CPU |
| Quotas and autoscaler | kube_resourcequota used versus hard; unschedulable pods, failed scale-ups, node group at maximum | A blocked Deployment looks like nothing at all; elasticity may not work |
Requests commitment per cluster, counting only running pods (completed pods keep their requests in the metric, so filter them out):
sum by (resource) (
    kube_pod_container_resource_requests{resource=~"cpu|memory"}
  * on (namespace, pod) group_left ()
    (kube_pod_status_phase{phase="Running"} == 1)
)
/
sum by (resource) (kube_node_status_allocatable{resource=~"cpu|memory"})
Group by node instead of resource for the per-node view; swap in kube_pod_container_resource_limits for overcommit, where a ratio well above 1 is normal and the question is how far. N+1 headroom is the same sum against a smaller denominator: if the largest node disappears, can the others hold today's requests?
sum(kube_pod_container_resource_requests{resource="cpu"}
    * on (namespace, pod) group_left () (kube_pod_status_phase{phase="Running"} == 1))
/
(sum(kube_node_status_allocatable{resource="cpu"}) - max(kube_node_status_allocatable{resource="cpu"}))
Above 1 means one node failure leaves pods with nowhere to go. For zones, subtract the largest zone's allocatable, using a zone label from kube_node_labels (allow-list it). This ignores DaemonSets, affinity, taints and disruption budgets, but as an early warning it is hard to beat.
Where the data comes from
- kube-state-metrics for allocatable and capacity, requests and limits, phases and quotas, and the kubelet and cAdvisor for real usage (see The minimum metric set).
- Right-sizing suggestions come from the Vertical Pod Autoscaler in recommendation mode (
updateMode: "Off"), which computes suggested requests without changing anything. Treat them as input to a review, not as policy. - The cluster autoscaler serves metrics on port 8085 by default, including
cluster_autoscaler_unschedulable_pods_count,cluster_autoscaler_failed_scale_ups_total,cluster_autoscaler_nodes_countandcluster_autoscaler_max_nodes_count(names as listed in its metrics documentation; check your version), plus a status ConfigMap and events such asNotTriggerScaleUp. A node group at its maximum plus unschedulable pods means the autoscaler cannot help. - Forecasting:
predict_linearover a recorded ratio turns a snapshot into a trend, for examplepredict_linear(commitment[14d:1h], 30*24*3600) > 1with the commitment query as a subquery or recording rule.
Pitfalls
- Wrong requests make the ratio meaningless: inflated requests look like a full cluster, missing requests like an empty one. Fix requests first (Layer 5).
- A healthy average hides fragmentation: many nodes at 70 percent and none that can fit a large pod.
- Pod density and addresses can run out first: some CNIs draw pod IPs from the network's address ranges (the AWS VPC CNI is one example), so subnets, not CPU, can cap growth.
- A
ResourceQuotafailure creates no Pending pod, so alert on quota usage before it hits 100 percent, and review capacity weekly, not only when an alert fires.
Security is a topic of its own. A dedicated post on Kubernetes security monitoring is in preparation. This guide touches it only where monitoring overlaps: audit logs (Layer 3) and eBPF runtime visibility. The main building blocks are runtime threat detection (Falco-style rules), audit-log analysis, and image and supply-chain signals.
Best practices checklist
Layer 1: Hardware and kernel
- CPU, memory, disk (space and inodes), I/O and network saturation are collected per node, not only as cluster averages; disk and inode alerts are predictive. Kubelet, runtime and kernel logs come from the node journal.
Layer 2: Nodes
- Kubelet and cAdvisor are scraped from every node with empty-label series dropped; CPU throttling, container PSI (where kernel and kubelet support it) and the memory working set are measured. Volume metrics exist, which means the CSI driver reports them.
- Node conditions and eviction thresholds are alerted on, not only watched.
Layer 3: Control plane
- You know which components you can scrape on your platform (including etcd's separate metrics port) and which are hidden; external probes and a canary workload compensate.
- Control plane and audit logs are collected (via the provider's export on hosted clusters), with an audit policy that logs Secrets at Metadata level only. Security monitoring beyond that is out of scope here; a dedicated post is in preparation.
Layer 4: Cluster state
- kube-state-metrics is scraped once, and Warning events are collected as logs by a singleton, with their counts. Rollout gaps, crash loops, OOM kills, pending pods, PVCs, HPAs, failed jobs and quota usage are alertable.
Layer 5: Workloads
- Every container has requests, memory limits are deliberate, probes exist and do not depend on shared downstream services.
- Services expose rate, errors and duration, log structured JSON with trace IDs, and are scraped by annotation, monitor object or integration.
Networking
- Services without ready endpoints, ingress errors and certificate expiry are alerted on; DNS amplification, TCP retransmits and policy drops are on a dashboard.
Collection
- Agents run per node; cluster-wide scrape targets are scraped once or sharded (or tapped from the platform's own stack); events and cluster receivers run as singletons; tail sampling sits behind trace-aware load balancing.
- Every pod metric carries a workload owner name, the enrichment RBAC (including ReplicaSets) is verified, and churning attributes such as the pod UID are removed before export.
- Series have a budget, the minimum metric set is the baseline, and only the resource attributes you filter by become labels.
- eBPF, if used, is limited to selected services, runs with minimal capabilities, and is tested with every node image upgrade. The pipeline monitors itself, and a watchdog alert proves the alert path works.
Alerting and capacity
- Pages are limited to symptoms, SLO burn and the few control plane failures that are themselves outages; everything else is a ticket or a dashboard, with an owner, a runbook and an action.
- Requests commitment, N+1 headroom, quotas and pod density are watched per cluster and per node, and capacity is reviewed weekly with a forecast.
Sources and further reading
- Kubernetes documentation: Metrics for Kubernetes system components, Understand PSI metrics, Auditing and kubeadm implementation details
- etcd documentation: Metrics. Google SRE Workbook: Alerting on SLOs. kubernetes-mixin: the standard alert and dashboard set behind kube-prometheus
- Reference implementation: Grafana's k8s-monitoring Helm chart (default allow lists, collector roles, remove list), a widely used example of the patterns above
- OpenTelemetry: eBPF Instrumentation (OBI), the k8sattributes processor, and the k8sobjects and kubeletstats receivers
- Metrics references: node-exporter, kube-state-metrics, cAdvisor, Cluster Autoscaler, cert-manager, Cilium Hubble, node-problem-detector, and Prometheus as an OpenTelemetry backend
- Platforms: EKS control plane logs, EKS metrics, GKE metrics, GKE logs, AKS metrics, AKS resource logs, OpenShift monitoring, Rancher monitoring, RKE2 server configuration, K3s architecture, Kubermatic Kubernetes Platform concepts
- eBPF-based tools: Cilium Hubble, Pixie, Parca. Our related posts: Kubernetes CronJob monitoring, Cut your observability bill at the source