Advanced Prometheus Querying For Sparse Data
Why do PromQL metrics disappear when you zoom out? Learn how the 5-minute lookback delta, staleness markers, and step intervals silently drop sparse data — and the advanced query techniques to fix it. Applies to Prometheus, Grafana Mimir, and Thanos.


"Querying sparse metrics data in promql is like waiting for your teenager to text you back - it only happens once a day, usually at 2 a.m., and the reply is just 'k'."
opensight.ch - roman hüsler
If you've been working with Prometheus PromQL for a while, you've probably had that moment — staring at a Grafana dashboard wondering why a perfectly healthy metric just vanished. Why measurement peaks disappear when you increase the time range. Or why your rate() occasionally returns nothing for a metric that clearly has data. Not because the data wasn't there — but because PromQL's staleness handling and lookback mechanics decided it wasn't relevant anymore.
This post is about that. About what happens under the hood when your metrics sample rate goes below 5 minutes, and advanced query techniques are needed in order to deal with it.

Content
- TL;DR
- PromQL in 60 Seconds
- Instant vs Range Queries
- Instant Vectors vs Range Vectors
- The 5-Minute Lookback Delta
- Step Intervals — Why Spikes Vanish When You Zoom Out
- Staleness Markers — The Silent Killer
- Range Vectors to the Rescue
- rate() and increase() — The Counter Trap
- Subqueries — When You Need to Aggregate an Aggregation
- absent() vs absent_over_time() — Detecting the Gaps
- Practical Patterns for Common Scenarios
- Key Takeaways
TL;DR
PromQL has a 5-minute lookback window and staleness markers that can silently swallow your sparse metrics. If your scrape interval is long (5 minutes plus), your metrics are bursty, or you're working with batch jobs — standard queries will betray you. Whether you run vanilla Prometheus, Grafana Mimir, or Thanos — the PromQL engine underneath is the same, and so are these quirks. This post is intended for SREs and covers the mechanics behind that, and the advanced techniques to work around it.
PromQL in 60 Seconds
Before diving into the quirks, let's establish the terminology. PromQL is the query language shared by Prometheus, Grafana Mimir, Thanos, and other compatible backends. The staleness and lookback behaviors described in this post apply to all of them. PromQL has two fundamental query types and two data types that interact in ways that matter for sparse data.
Instant vs Range Queries
An instant query evaluates an expression at a single point in time and returns a snapshot. This is what you get when you type a query into the Prometheus expression browser. A range query evaluates the same expression repeatedly across a time window at regular intervals called steps. This is what Grafana uses to draw graphs — it sends a range query with start, end, and step parameters.
# Instant query — evaluated once at "now":
http_requests_total{job="api"}

# Range query — Grafana asks Prometheus:
# "evaluate this expression every 15s from 10:00 to 11:00"
# → returns an array of results, one per step
Instant Vectors vs Range Vectors
An instant vector is a set of time series where each series has exactly one sample — a single value at one point in time. Most PromQL expressions return instant vectors. A range vector is a set of time series where each series contains multiple samples over a time window. You create a range vector by adding a duration in square brackets:
# Instant vector — one value per series:
http_requests_total{job="api"}

# Range vector — all samples from the last 5 minutes per series:
http_requests_total{job="api"}[5m]
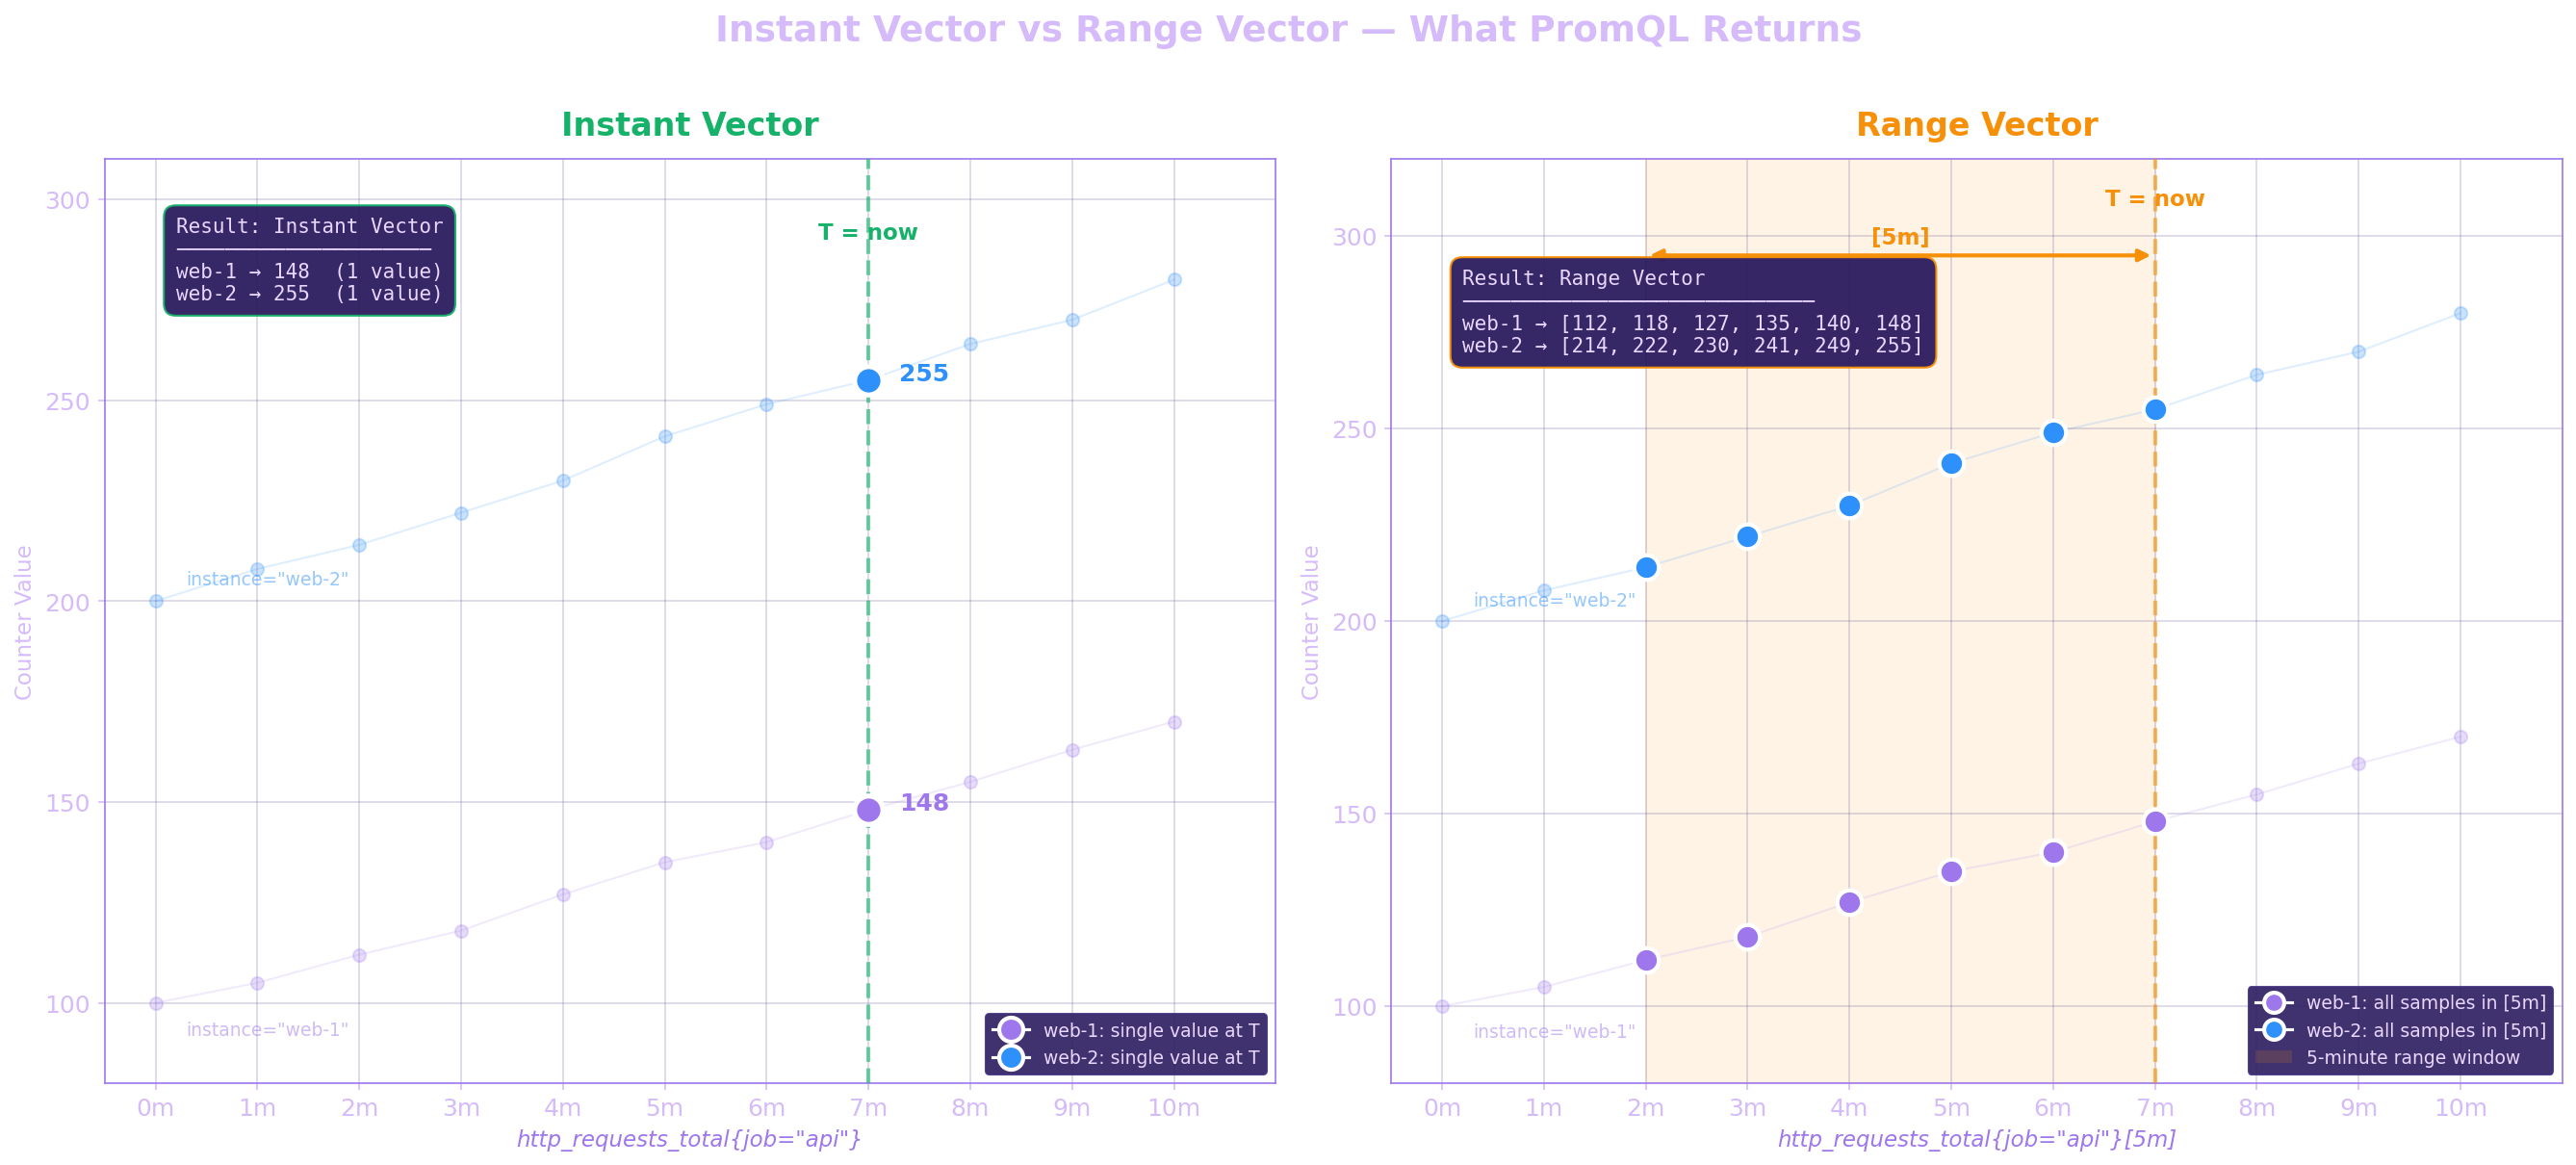
Range vectors can't be graphed directly — they need to be reduced to instant vectors using aggregation functions like rate(), avg_over_time(), or max_over_time(). These functions take the multiple samples in a range vector and collapse them into a single value per series.
# rate() takes a range vector and returns an instant vector:
rate(http_requests_total{job="api"}[5m])

# max_over_time() returns the highest sample in the window:
max_over_time(cpu_usage{instance="web-1"}[1h])

# last_over_time() returns the most recent sample in the window:
last_over_time(batch_job_status{job="etl"}[30m])
You'll also encounter the subquery syntax [range:resolution] — this takes an instant vector expression and evaluates it repeatedly at a given resolution over a time window, producing a range vector. This is how you nest aggregations:
# Subquery syntax: <instant_expr>[range:resolution]
#
# [2m:15s] means:
#   "evaluate this expression every 15s over the last 2 minutes"
#   → produces a range vector with ~8 samples
#
# Example: average of 5-minute rates, computed every 15s over 2 minutes:
avg_over_time(rate(http_requests_total[5m])[2m:15s])
The key insight for this entire post: instant vectors are subject to the 5-minute lookback and staleness rules. Range vectors are not. This difference is what makes *_over_time() functions the primary tool for querying sparse data.
The 5-Minute Lookback Delta
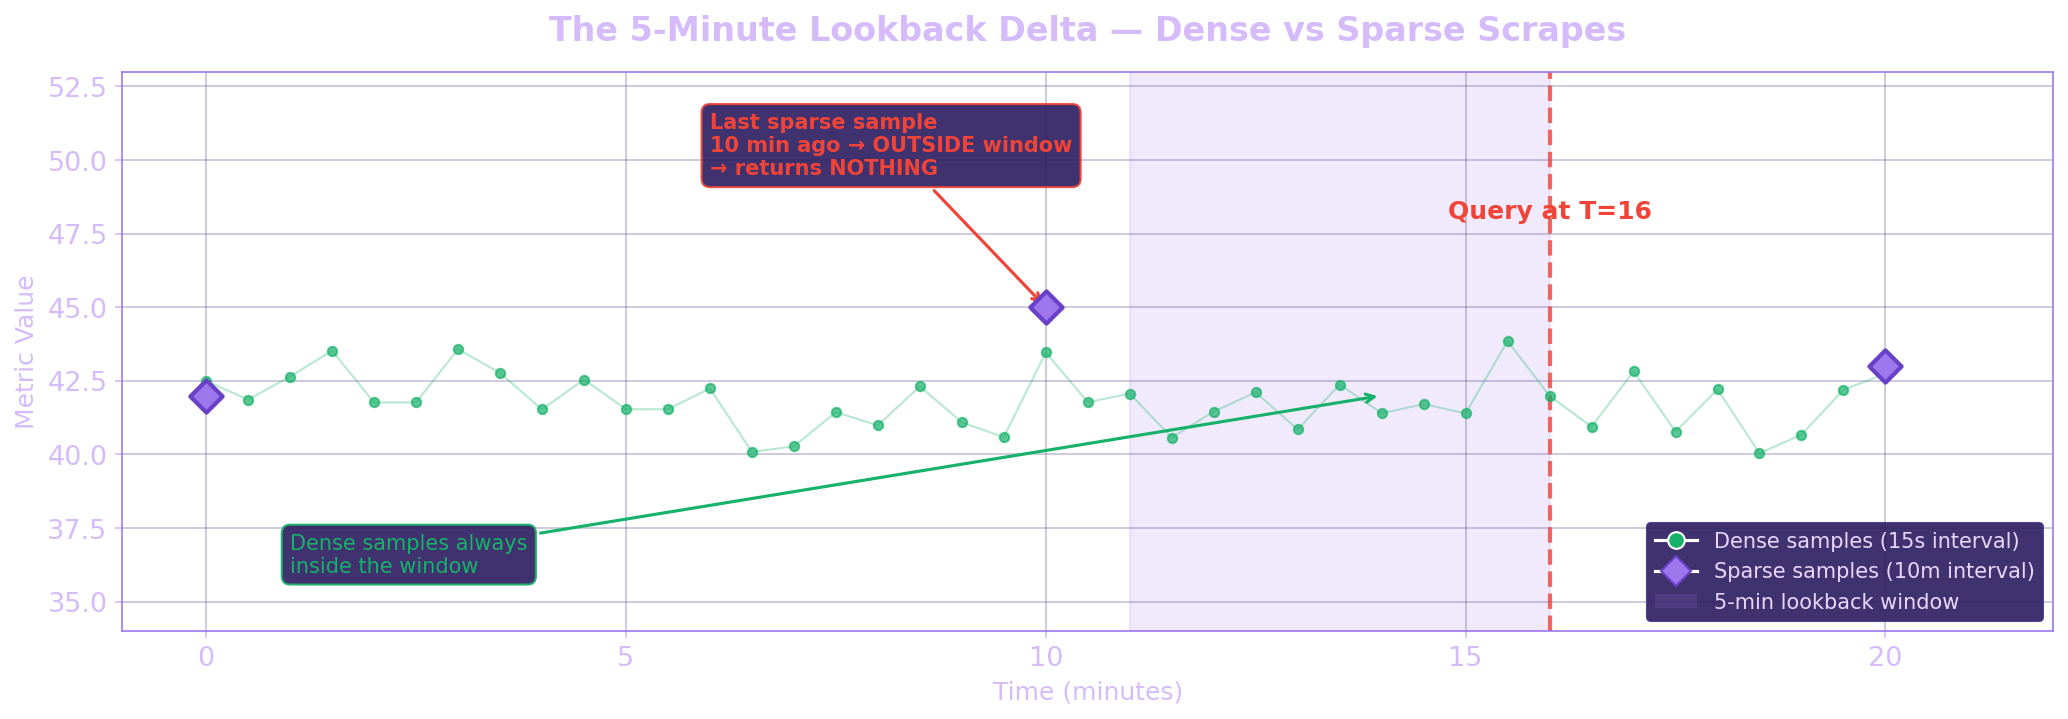
Here's the thing most people don't realize about PromQL: every instant query has a hidden 5-minute window. When Prometheus evaluates a query at time T, it doesn't just look for a sample at exactly T — it looks backwards up to 5 minutes (the --query.lookback-delta) for the most recent sample.
This works great when your scrape interval is low like 15s or 30s. There's always a recent sample within that window. But the moment your data gets sparse — batch jobs reporting every 10 minutes or once a day, a service that only emits metrics on events, or a target that occasionally misses scrapes — that 5-minute window becomes a cliff.
# This looks fine with 15s scrape intervals
up{job="my-service"}

# But with a 10-minute scrape interval?
# At evaluation time T, if the last sample was 6 minutes ago — gone.
# PromQL returns nothing. No error. No warning. Just empty.
And it gets worse. In range queries, Prometheus evaluates the expression at every step within the range. If your step is 1 minute but your data only lands every 10 minutes, most evaluation points will find nothing — producing a graph with massive gaps or no data at all.
Step Intervals — Why Spikes Vanish When You Zoom Out
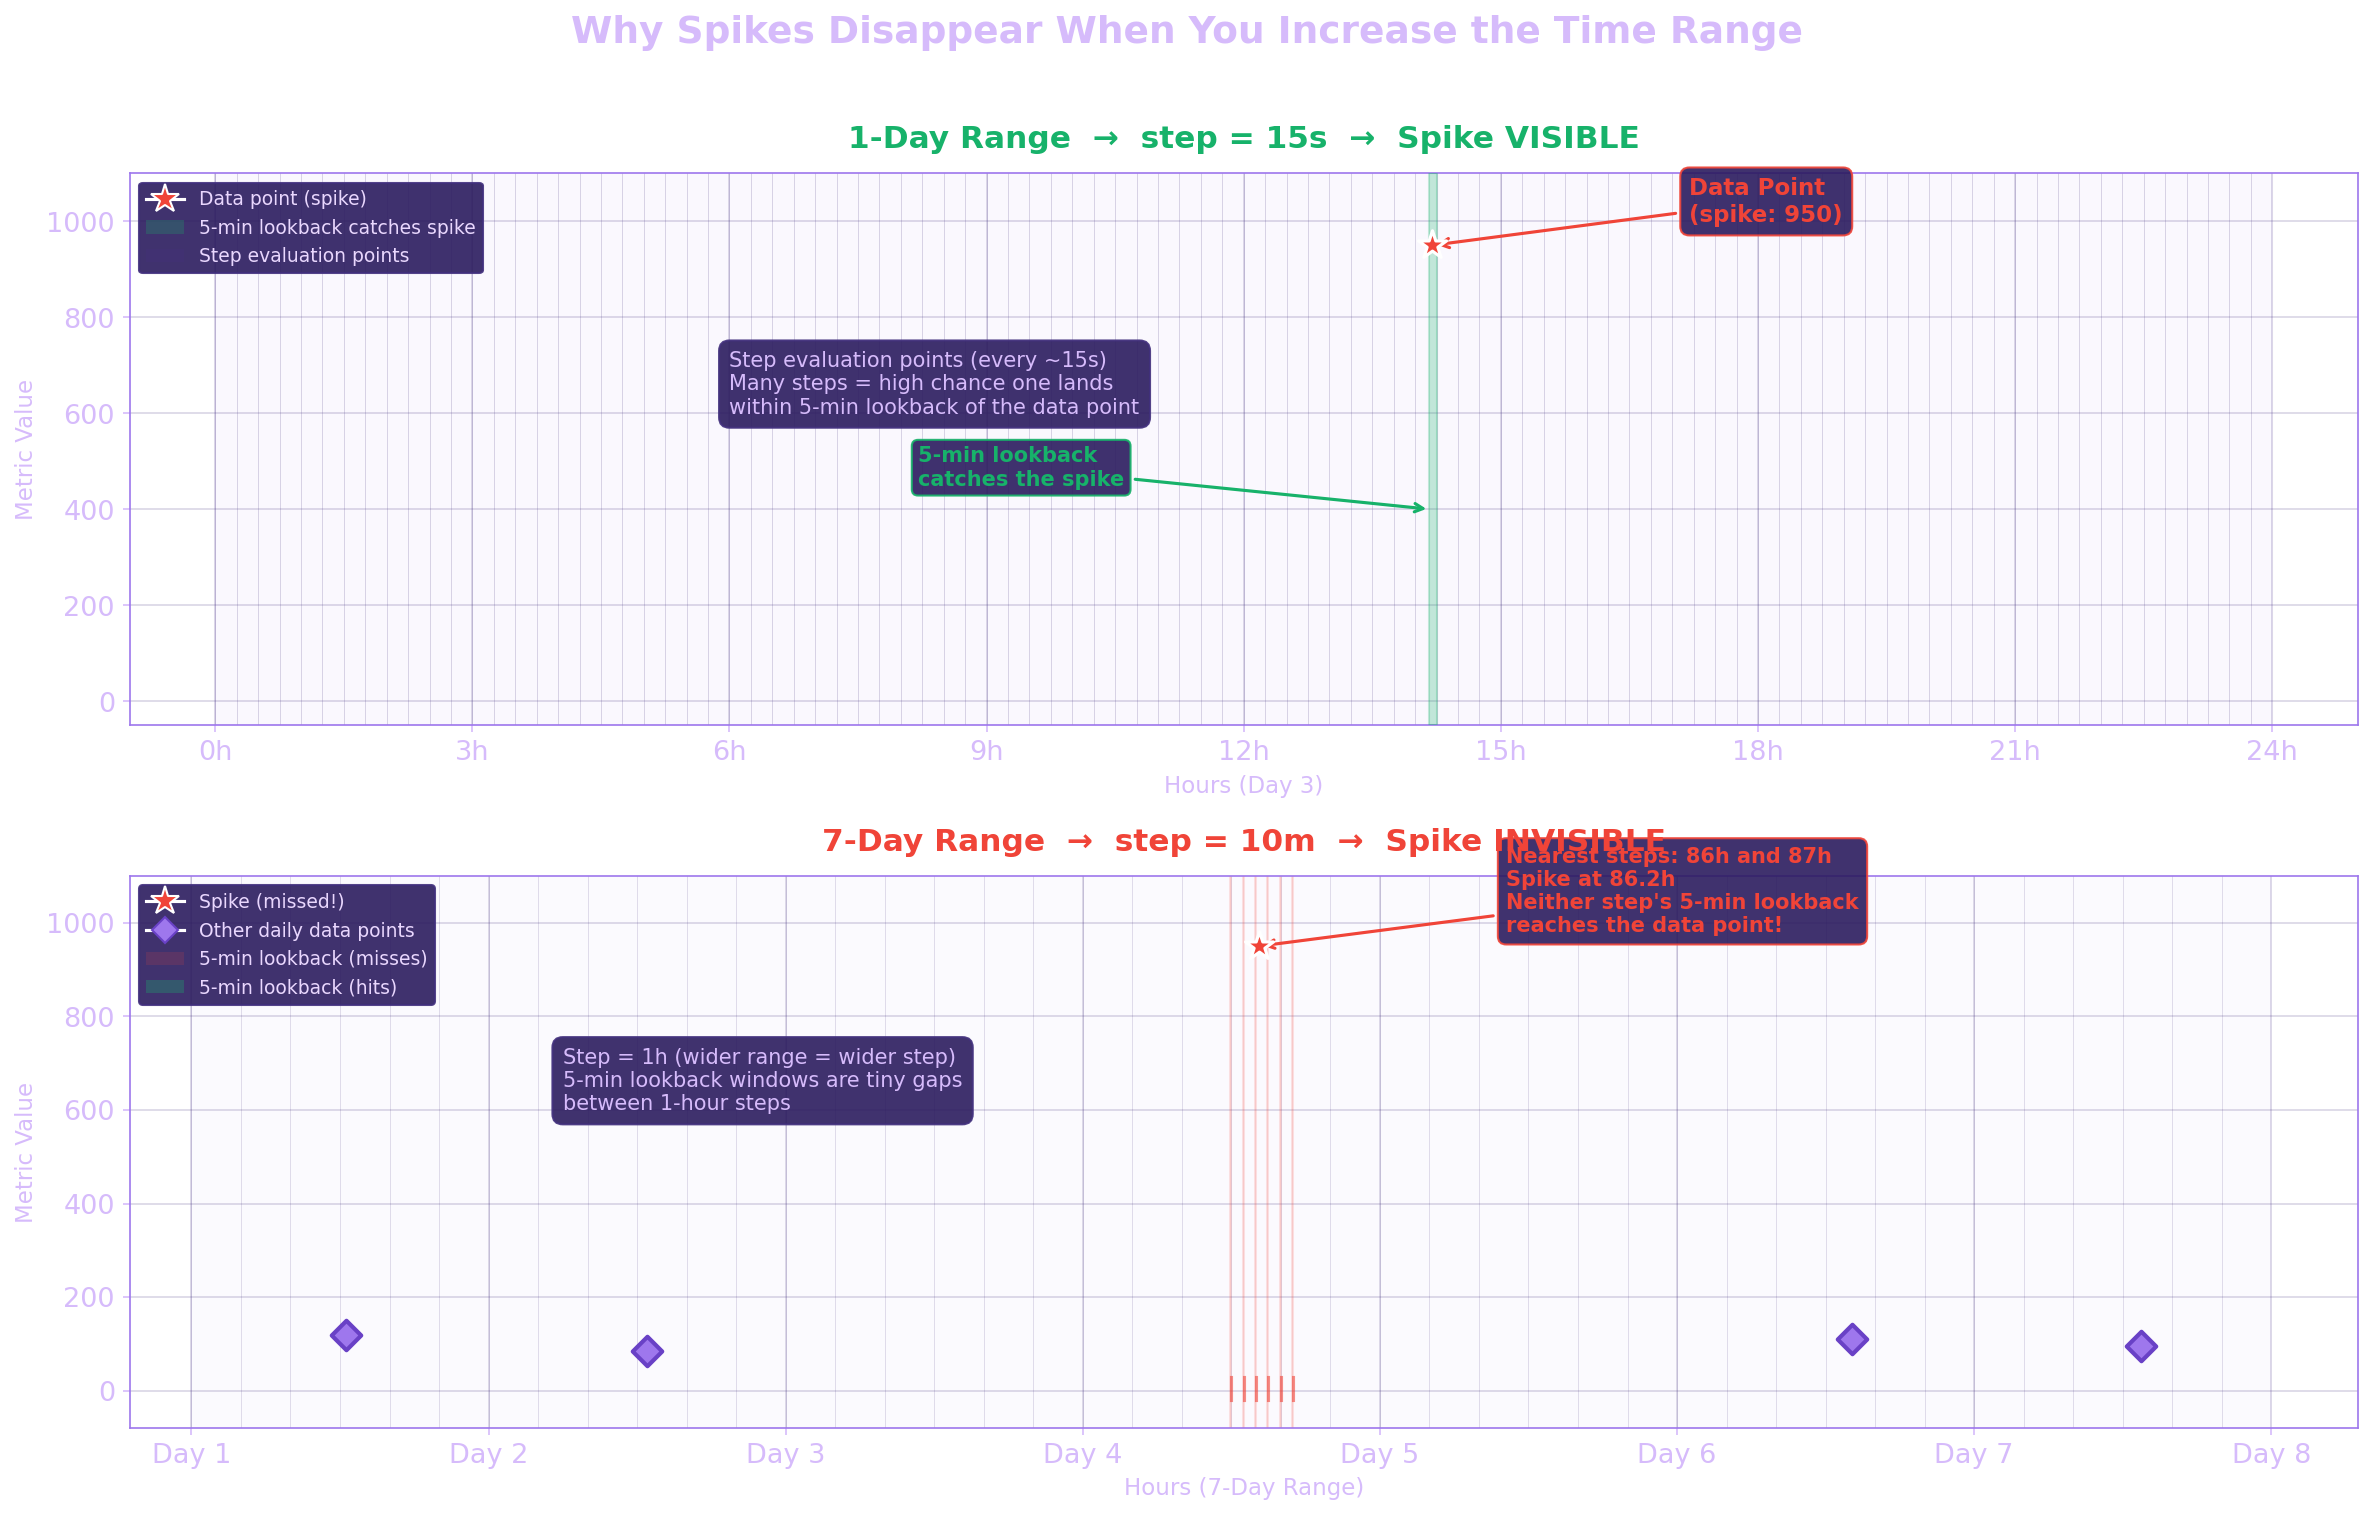
This is probably the most confusing PromQL behavior for people new to Prometheus: you're looking at a dashboard, you see a clear spike. You widen the time range to get more context — and the spike simply disappears. The data is still in Prometheus. The metric hasn't changed. But the query no longer finds it.
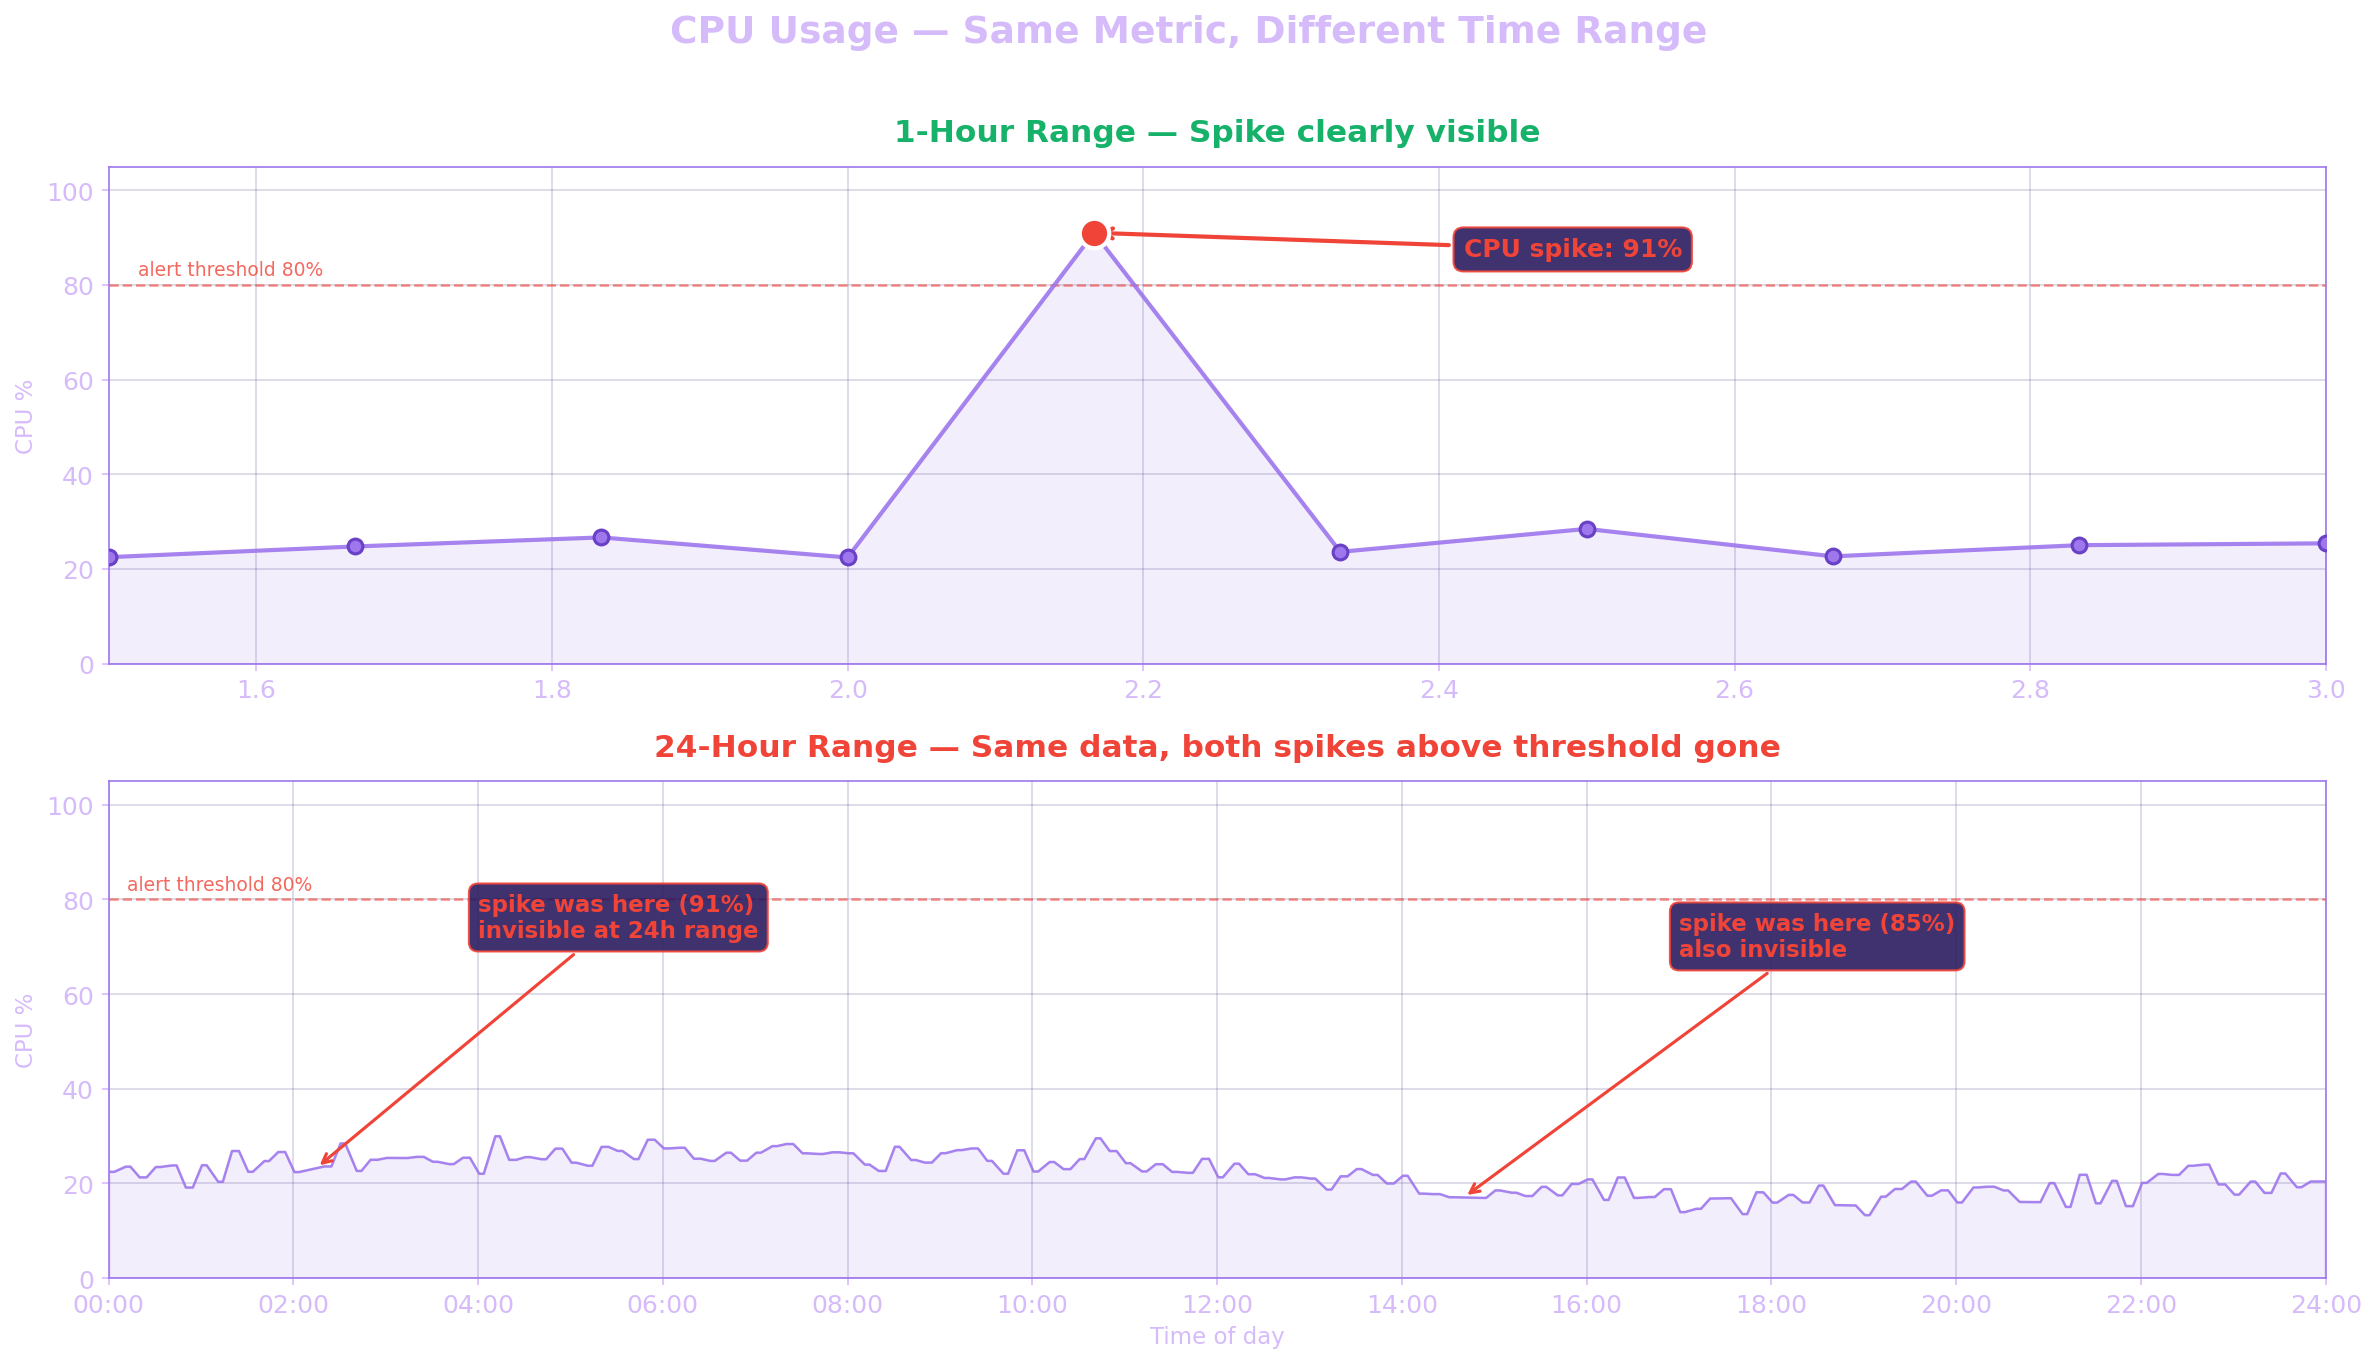
Here's why. When Grafana (or any PromQL client) executes a range query, it doesn't fetch every single stored sample. Instead, it evaluates the query expression at regular intervals called steps. The step size is determined by the time range and the panel width — Grafana typically calculates it as time_range / panel_width_in_pixels, aiming for roughly one data point per pixel.
- 1-day range on a 1000px panel → step ≈ 86s → ~1000 evaluation points
- 7-day range on a 1000px panel → step ≈ 10min → ~1000 evaluation points
- 30-day range on a 1000px panel → step ≈ 43min → ~1000 evaluation points
At each step, Prometheus applies the 5-minute lookback to find the most recent sample. And here's the math that kills sparse data:
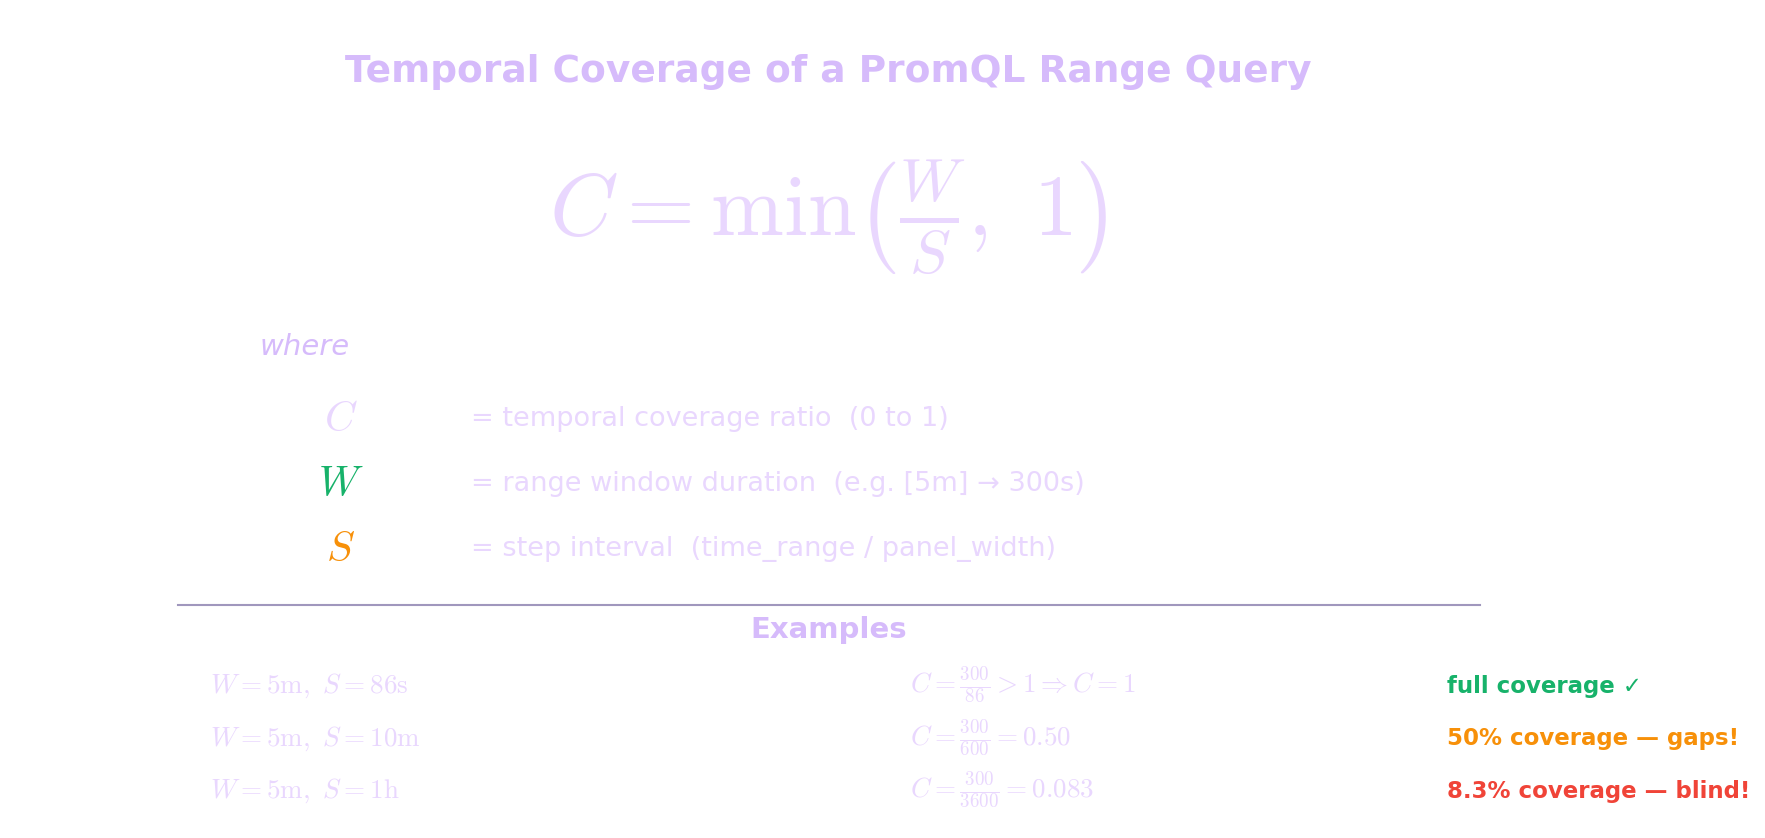
With a 1-hour step interval and a 5-minute lookback, each step only "sees" a 5-minute window out of every 60 minutes. That's 8.3% coverage. The remaining 91.7% of the time is a blind spot. If your data point happens to land in that blind spot — and with sparse data, it almost certainly will — it's invisible to the query.
We can formalize this as the temporal coverage ratio — the fraction of the timeline that is actually visible to the query engine:
Let's zoom into what actually happens around the spike:
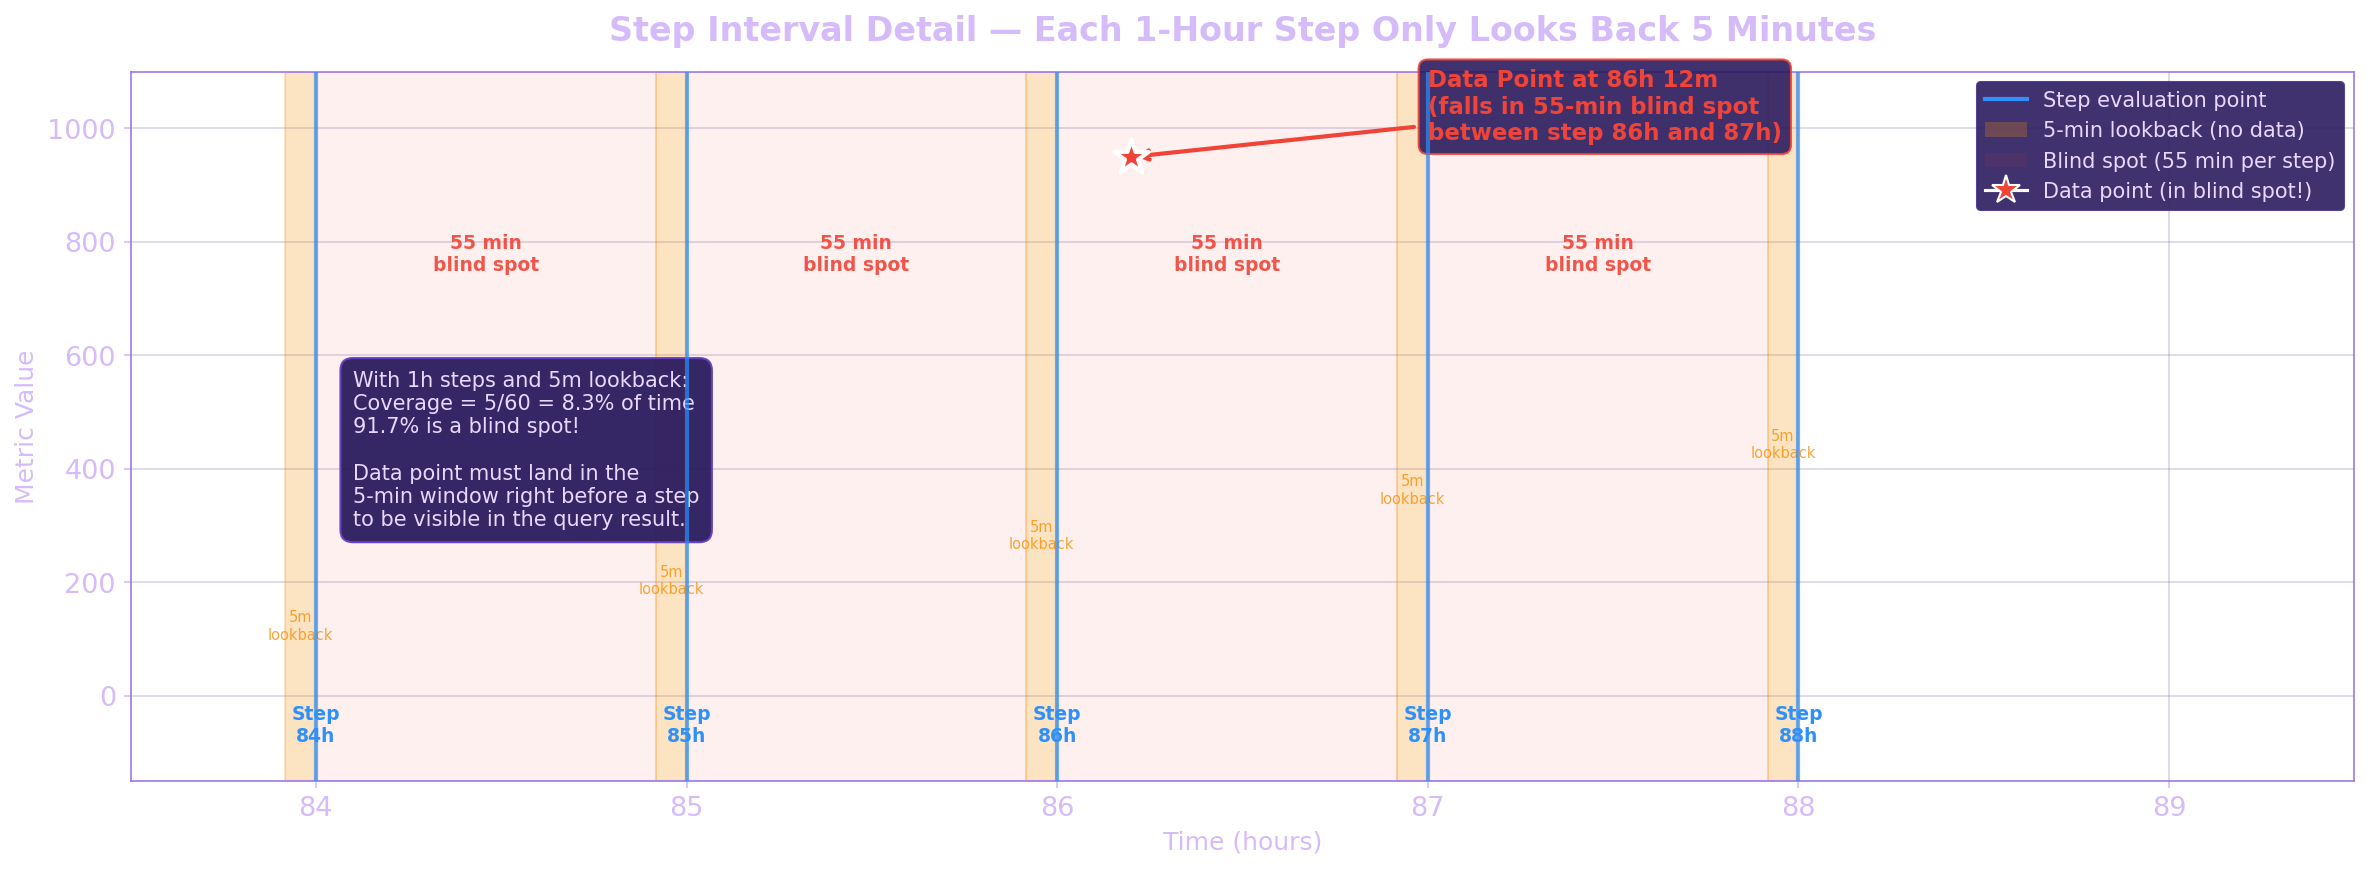
This is not a bug — it's how PromQL range queries are designed. The step interval is an optimization to avoid evaluating millions of points. But with sparse data, it creates a sampling problem: the query's evaluation grid and your data's timing are completely unaligned.
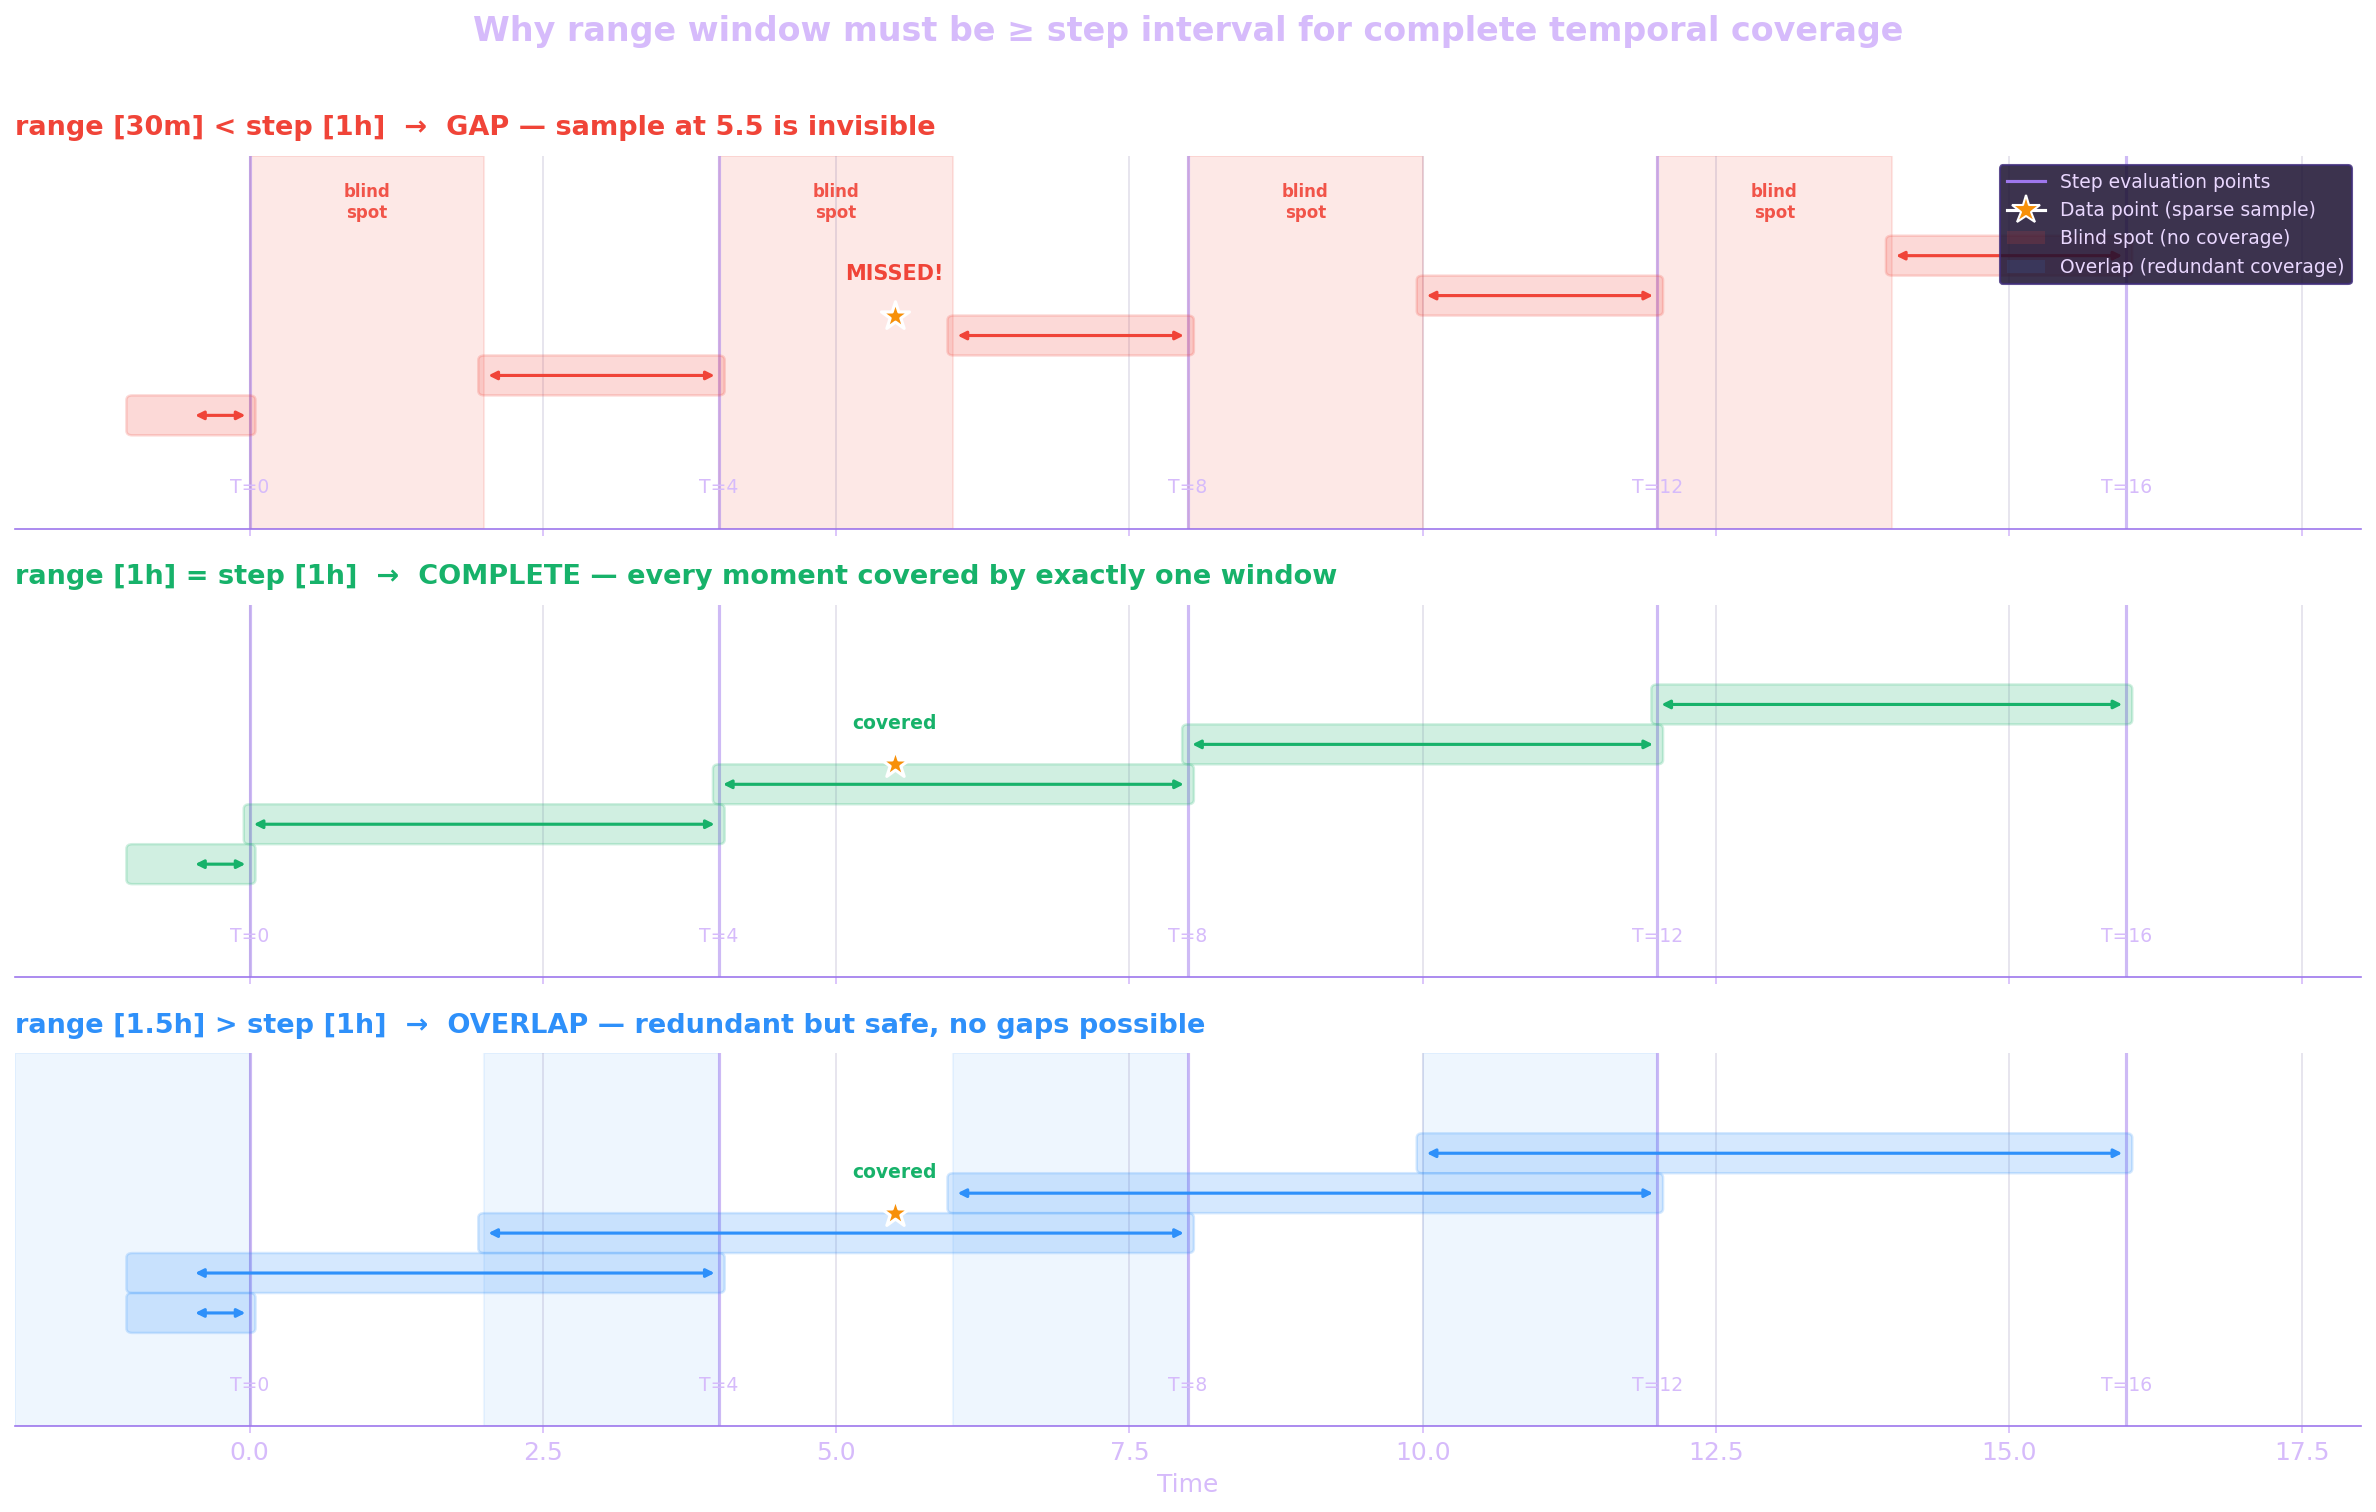
The fix is the same principle as before: use *_over_time() functions with a range window that's wider than your step interval. When you wrap your query in max_over_time(my_metric[1h]), each step evaluates a 1-hour range vector instead of looking for a single instant — and range vectors collect all samples in the window regardless of when they occurred.
# Instant query — spike visible at 1-day range, gone at 7-day range:
my_sparse_metric{job="batch"}

# Range vector — spike visible at ANY time range:
max_over_time(my_sparse_metric{job="batch"}[1h])

# The range window must be equal to (or greater than) your step interval
# for complete temporal coverage — ensuring all samples are considered
# For 7-day dashboards: steps are ~10min, so [15m] is safe
# For 30-day dashboards: steps are ~43min, so [1h] is safe
# For 90-day dashboards: steps are ~2h, so [3h] is safe
Why must the range window be at least as wide as the step? Because consecutive steps' range windows need to touch or overlap to guarantee no sample falls through the cracks. If your range is smaller than the step, there's a blind spot between each step's lookback window where data points are invisible. When range equals step, every moment in the timeline is covered by exactly one step's evaluation window — complete temporal coverage with no gaps.
Staleness Markers — The Silent Killer
Prometheus 2.0 introduced staleness markers: special NaN values injected when a time series disappears from a scrape target. The intent is good — if a metric stops being exposed, Prometheus marks it as stale so the query engine stops returning the last known value indefinitely.
But here's where it gets tricky with sparse data:
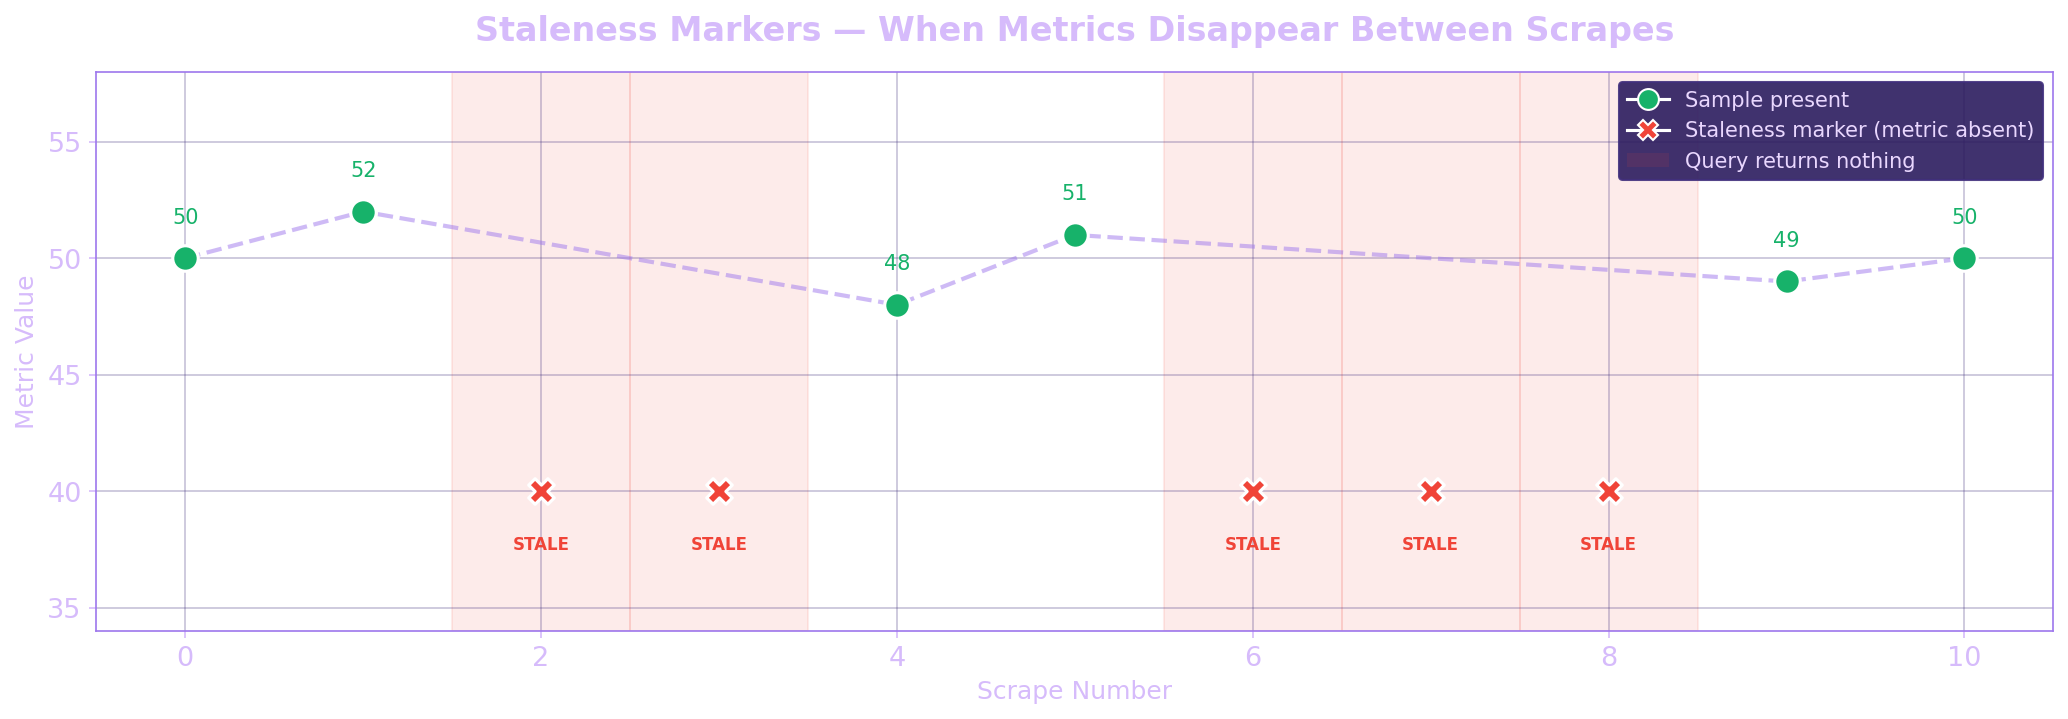
- A target gets scraped, metric is present → sample stored
- Next scrape, metric is absent (maybe it's a batch metric, or a conditional gauge) → staleness marker injected
- Your query hits the staleness marker → PromQL says "this series is gone" and returns nothing
- The metric comes back two scrapes later → you get data again, but the gap is real
The result: dashboards with intermittent holes, alerts that flap, and SREs who question their sanity.
Range Vectors to the Rescue
Here's the first key insight: range vector selectors ignore staleness markers. This is actually documented but rarely emphasized. When you use a range selector like [10m], Prometheus collects all raw samples in that window — stale markers are simply skipped.
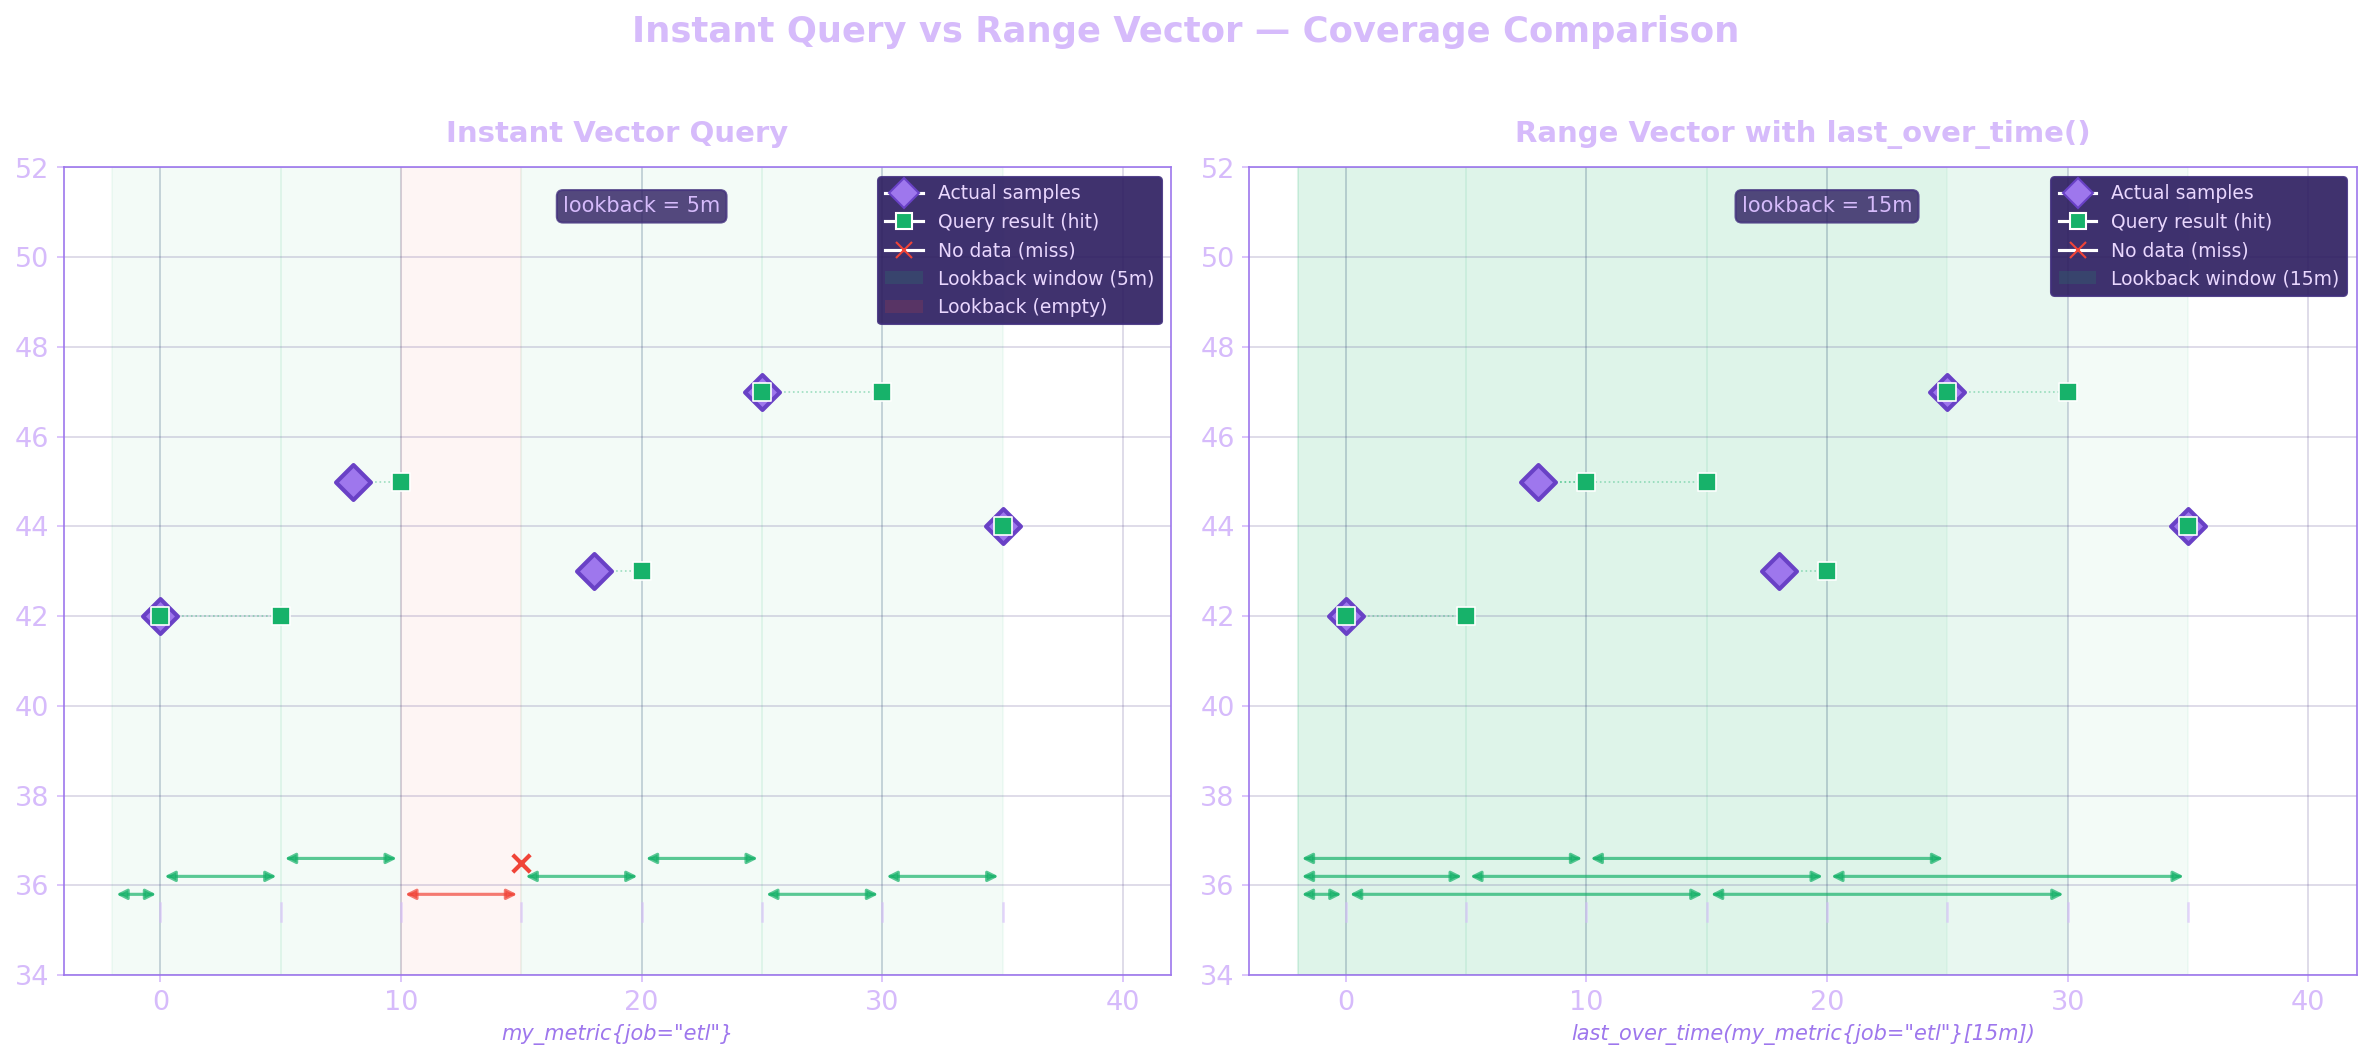
This means you can use *_over_time() functions to bridge the gaps:
# Instead of this (fails with sparse data):
my_batch_metric{job="etl"}

# Use this — grabs the last value within a 15m window:
last_over_time(my_batch_metric{job="etl"}[15m])

# Or if you want the max value seen in the last hour:
max_over_time(my_batch_metric{job="etl"}[1h])
last_over_time() is your best friend for sparse gauge metrics. It returns the most recent sample within the range, ignoring staleness. Set the range window to something comfortably larger than your expected reporting interval.
rate() and increase() — The Counter Trap
Counters and sparse data are a particularly nasty combination. rate() needs at least two samples within the range window to compute a per-second rate. With sparse data, you often only get one — or none.
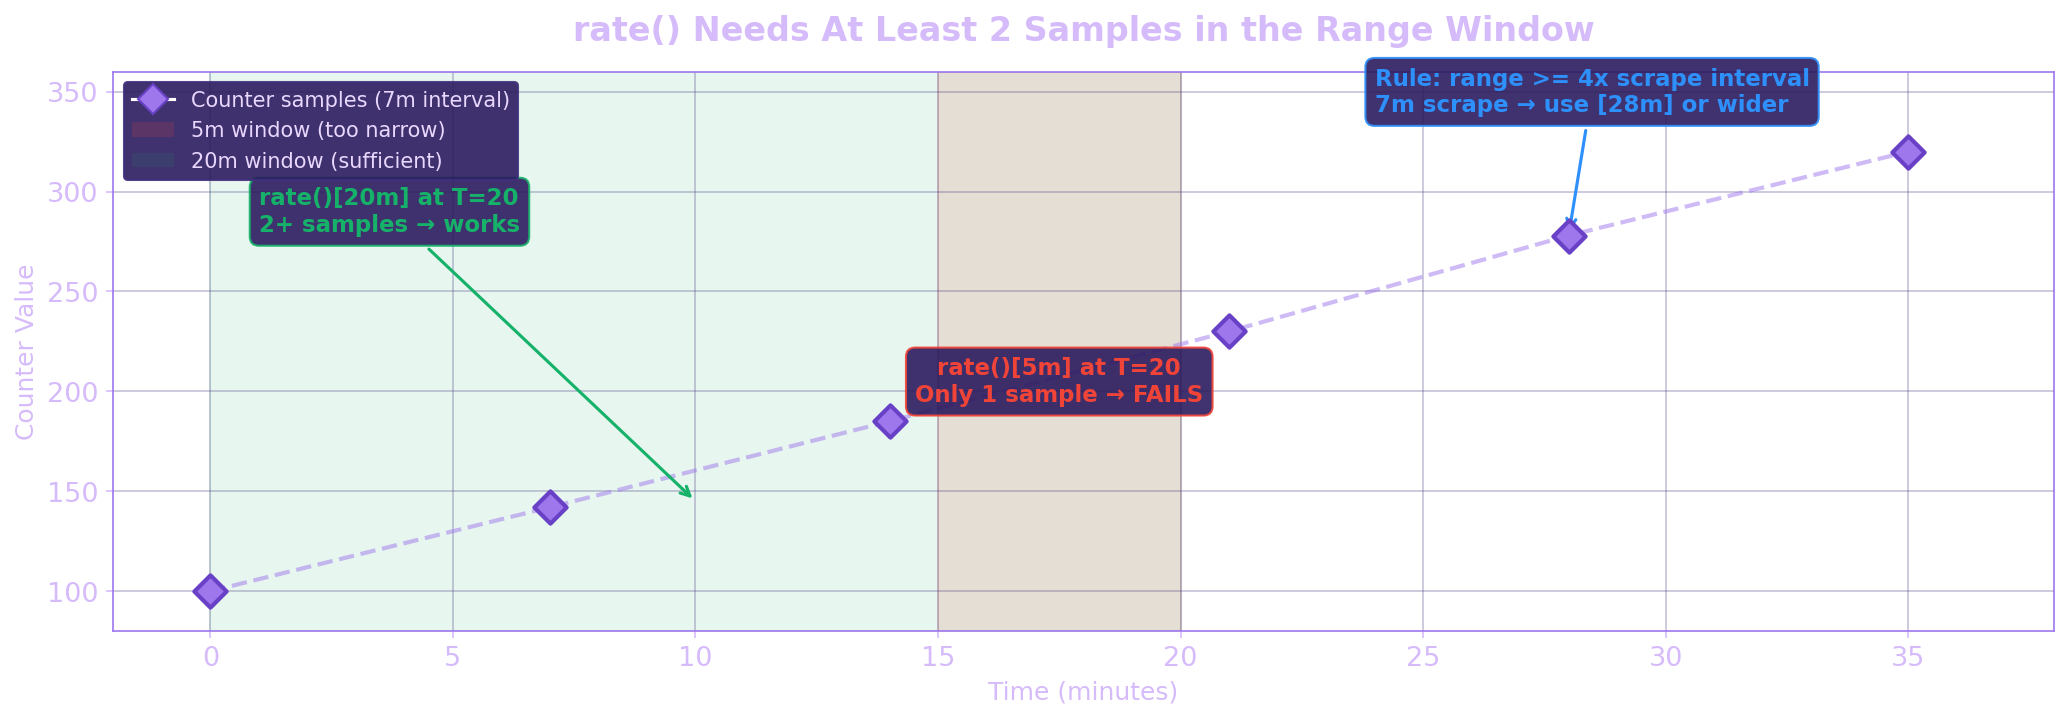
# With a 15s scrape interval, this works fine:
rate(http_requests_total{job="api"}[5m])

# But with sparse data (scrape every 5m), you need a wider window:
rate(http_requests_total{job="api"}[15m])

# Rule of thumb: range window >= 4x your scrape interval
# Why 4x? You need at least 2 samples, plus margin for missed
# scrapes and staleness. This is the Prometheus docs recommendation.
And then there's the edge case with increase(). Prometheus extrapolates the increase to cover the full range window, which can produce fractional values even for integer counters. With sparse data, this extrapolation becomes even more unreliable because the sample spacing is irregular.
If you need exact counts from sparse counters, consider using recording rules to pre-aggregate at a known interval, or switch to rate() and multiply by the window size yourself.
Subqueries — When You Need to Aggregate an Aggregation
Sometimes you need to aggregate an already-aggregated result over time. That's where subqueries come in. A subquery lets you evaluate an instant query over a range at a custom resolution:
# Syntax: <instant_query>[range:resolution]

# Average rate over the last hour, evaluated every 5 minutes:
avg_over_time(rate(http_requests_total[5m])[1h:5m])

# Max CPU usage (already aggregated by instance) over 24h:
max_over_time(
  max by (instance) (rate(node_cpu_seconds_total{mode!="idle"}[5m]))
[24h:5m])
For sparse data, subqueries are powerful because you can set the inner resolution to match your data frequency, and the outer range to cover the gaps. But use them carefully — they're expensive. Every subquery step generates a full inner evaluation. A [24h:1m] subquery means 1440 inner evaluations. Consider recording rules if you're using the same subquery in multiple dashboards.
absent() vs absent_over_time() — Detecting the Gaps
If you want to alert on missing sparse data, you need to pick the right tool:
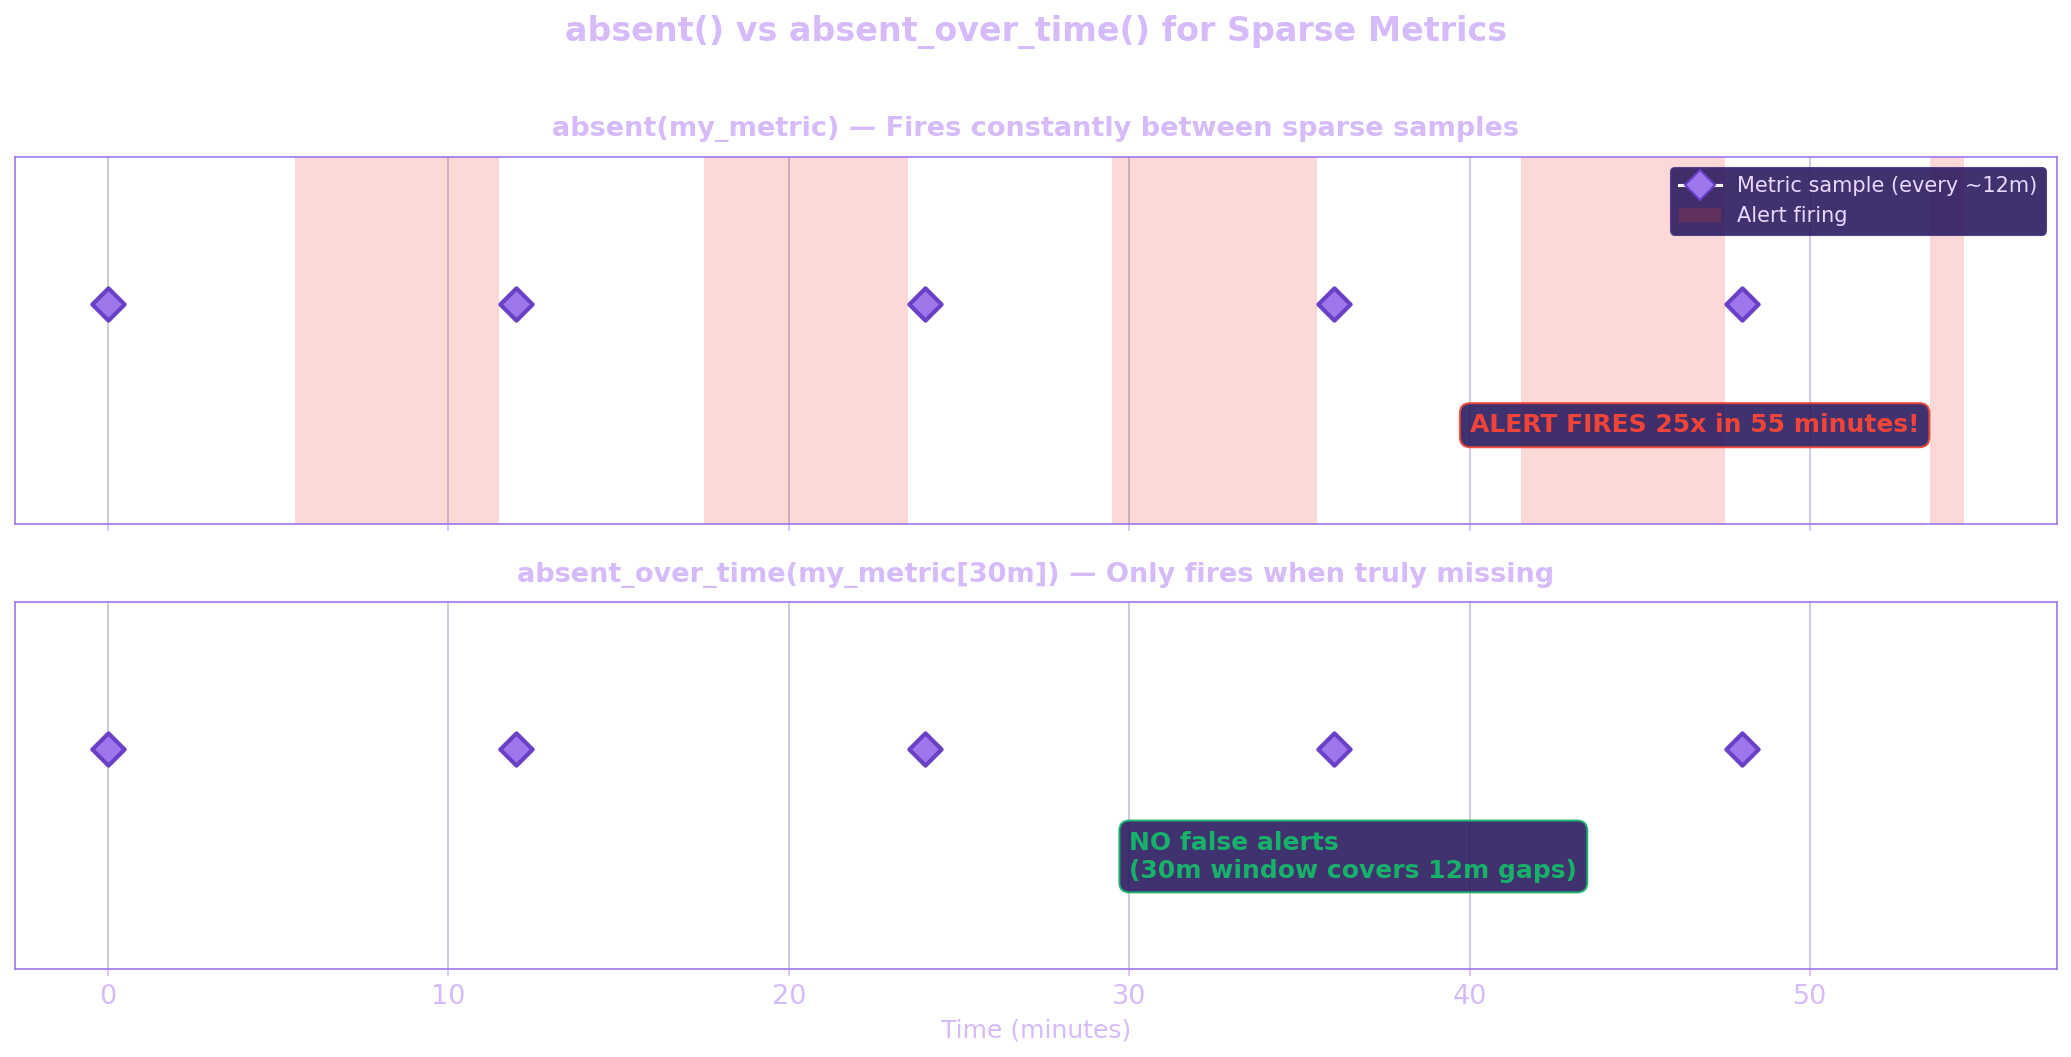
# absent() — fires when the metric has NO current value
# Respects staleness, so it fires immediately after a stale marker
absent(my_batch_metric{job="etl"})

# absent_over_time() — fires when NO samples exist in the window
# Ignores staleness markers, looks at actual samples
absent_over_time(my_batch_metric{job="etl"}[30m])
For sparse metrics, absent() will fire constantly between data points — not useful. absent_over_time() with a generous window is what you want. Set the window to 2-3x your expected reporting interval so you only alert when data is genuinely missing, not just sparse.
Practical Patterns for Common Scenarios
Batch Jobs (Pushgateway or Custom Exporter)
# Last known status of a batch job
last_over_time(batch_job_success{job="nightly-etl"}[25h])

# Alert if batch job hasn't reported in 25 hours
absent_over_time(batch_job_success{job="nightly-etl"}[25h])
Event-Driven Metrics (Only Emitted on Activity)
# Total errors in the last hour, even if metric is sparse
max_over_time(errors_total{service="payments"}[1h])
  -
min_over_time(errors_total{service="payments"}[1h])

# Or use increase with a wide enough window
increase(errors_total{service="payments"}[1h])
Long Scrape Intervals (Cost Optimization)
# If scraping every 5m, use at least 20m windows for rate:
rate(requests_total[20m])

# For dashboards, match your $__rate_interval or set a minimum:
rate(requests_total[$__rate_interval])
# Grafana's $__rate_interval auto-adjusts based on scrape interval
Recording Rules to Smooth Things Out
# rules.yml — pre-compute at a consistent interval
groups:
  - name: sparse_metrics
    interval: 5m
    rules:
      - record: job:batch_status:last
        expr: last_over_time(batch_job_success[25h])
      - record: job:request_rate:5m
        expr: rate(requests_total[20m])
Recording rules are evaluated at a fixed interval regardless of the underlying scrape frequency. This gives you a consistent time series that downstream queries can rely on without worrying about sparsity.
Key Takeaways
- The 5-minute lookback delta is the root cause of most "disappearing metrics" issues. If your data is sparser than 5 minutes, standard instant queries will have gaps. You can tune this globally with
--query.lookback-delta, but that affects everything. - Step intervals compound the problem. Wider time ranges mean wider steps, which means each evaluation point's 5-minute lookback covers a smaller fraction of the timeline. A spike that's visible on a 1-day view can vanish on a 7-day view — not because the data is gone, but because no step's lookback window happens to land on it.
- Staleness markers kill sparse gauge metrics. If a metric isn't present in every scrape, it gets marked stale. Use
last_over_time()to look through the staleness. - Range vectors ignore staleness. Switching from instant selectors to
*_over_time()functions is the single most effective technique for sparse data. - rate() needs at least 2 samples. With sparse counters, widen your range window to at least 4x the scrape interval.
- Subqueries are powerful but expensive. Use them when you need time-aggregation of an already-aggregated metric, but consider recording rules for anything used in multiple places.
- absent_over_time() over absent() for alerting on sparse metrics. The former looks for actual samples in the window; the latter respects staleness and will false-fire between sparse samples.
- Recording rules are your stabilizer. They produce a consistent output series regardless of input sparsity. Pre-compute anything you query often.
PromQL is a powerful language — whether you're querying Prometheus directly, Grafana Mimir, or Thanos — but its staleness and lookback mechanics were designed for the common case: densely-scraped infrastructure metrics at 15-30 second intervals. The moment you step outside that comfort zone — batch jobs, event-driven systems, cost-optimized long scrape intervals — you need to understand these internals to write queries that actually work.